Fetch.ai (FET)
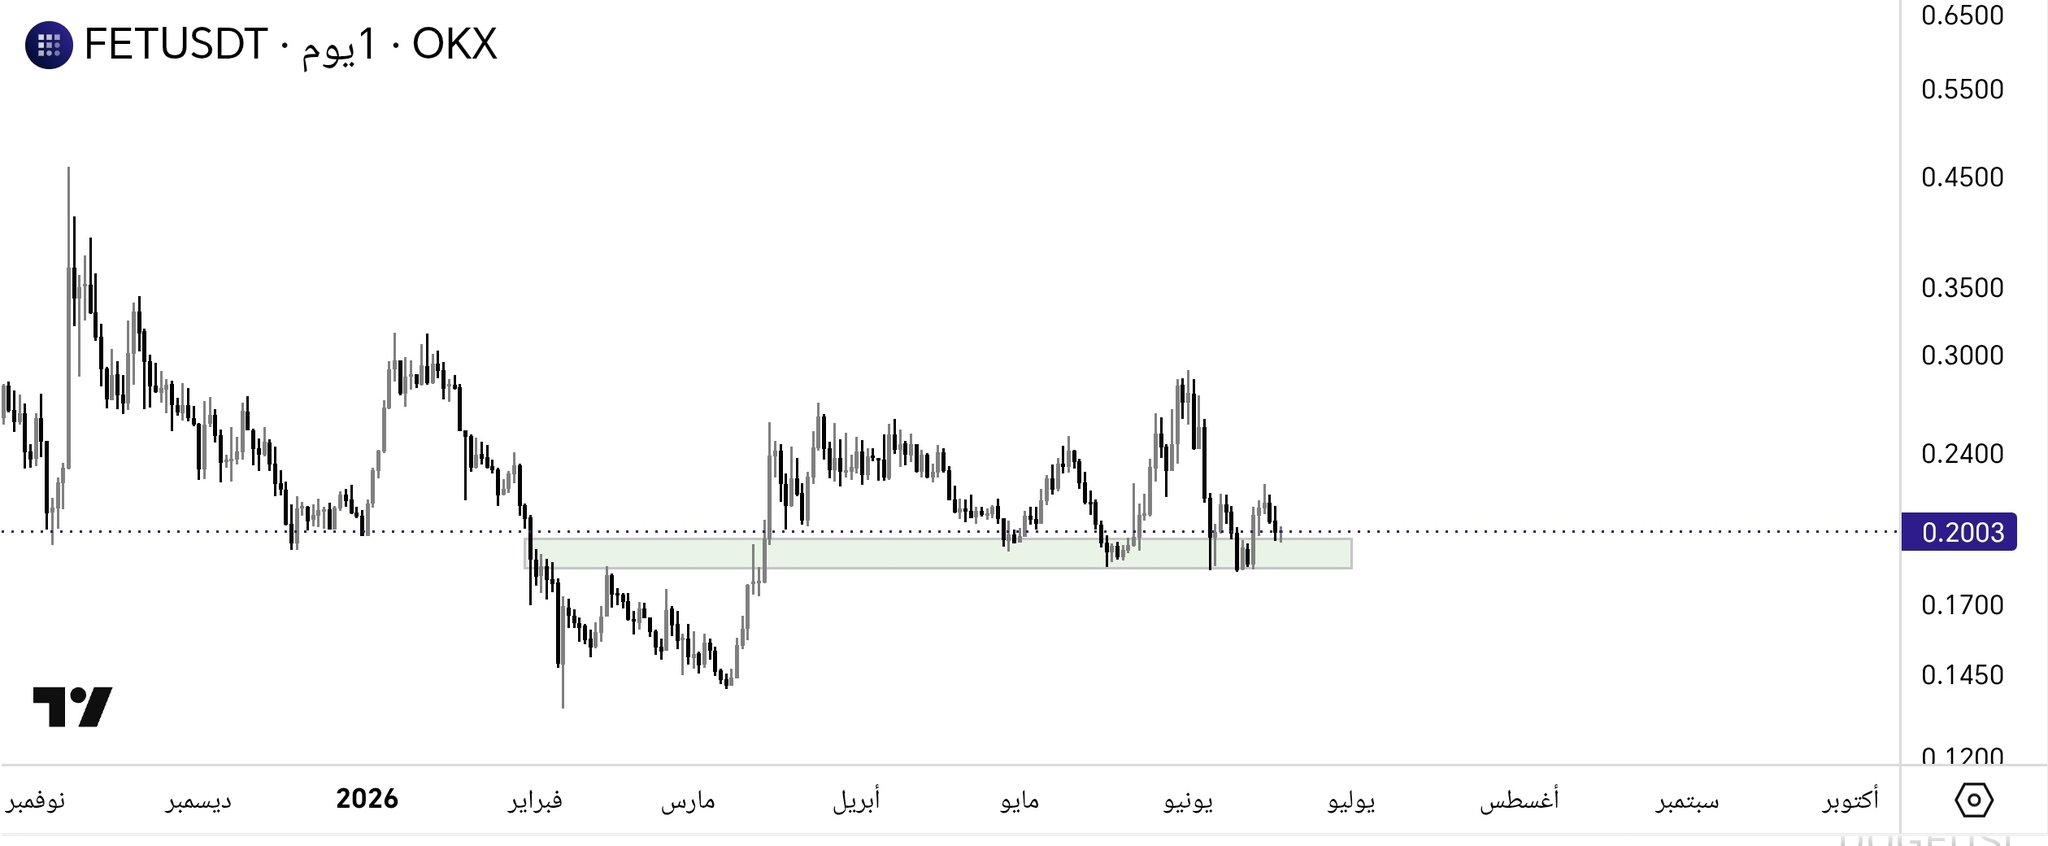
$0.1866 -1.01% 24H
- 51Chỉ số cảm xúc xã hội (SSI)+38.39% (24h)
- #117Xếp hạng nhịp đập thị trường (MPR)+34
- 5Đề cập trên mạng xã hội 24h+66.67% (24h)
- 80%Tỷ lệ tăng KOL 24h5 KOL đang hoạt động
- Tóm tắt
- Tín hiệu tăng giá
- Tín hiệu giảm giá
Chỉ số cảm xúc xã hội (SSI)
- Tổng quan dữ liệu51SSI
- Xu hướng SSI (7 ngày)Giá (7 ngày)Phân bổ cảm xúcCực kỳ lạc quan (20%)Tăng giá (60%)Giảm giá (20%)Thông tin chuyên sâu SSI
Xếp hạng nhịp đập thị trường (MPR)
- Thông tin chuyên sâu về cảnh báo
Bài đăng trên X
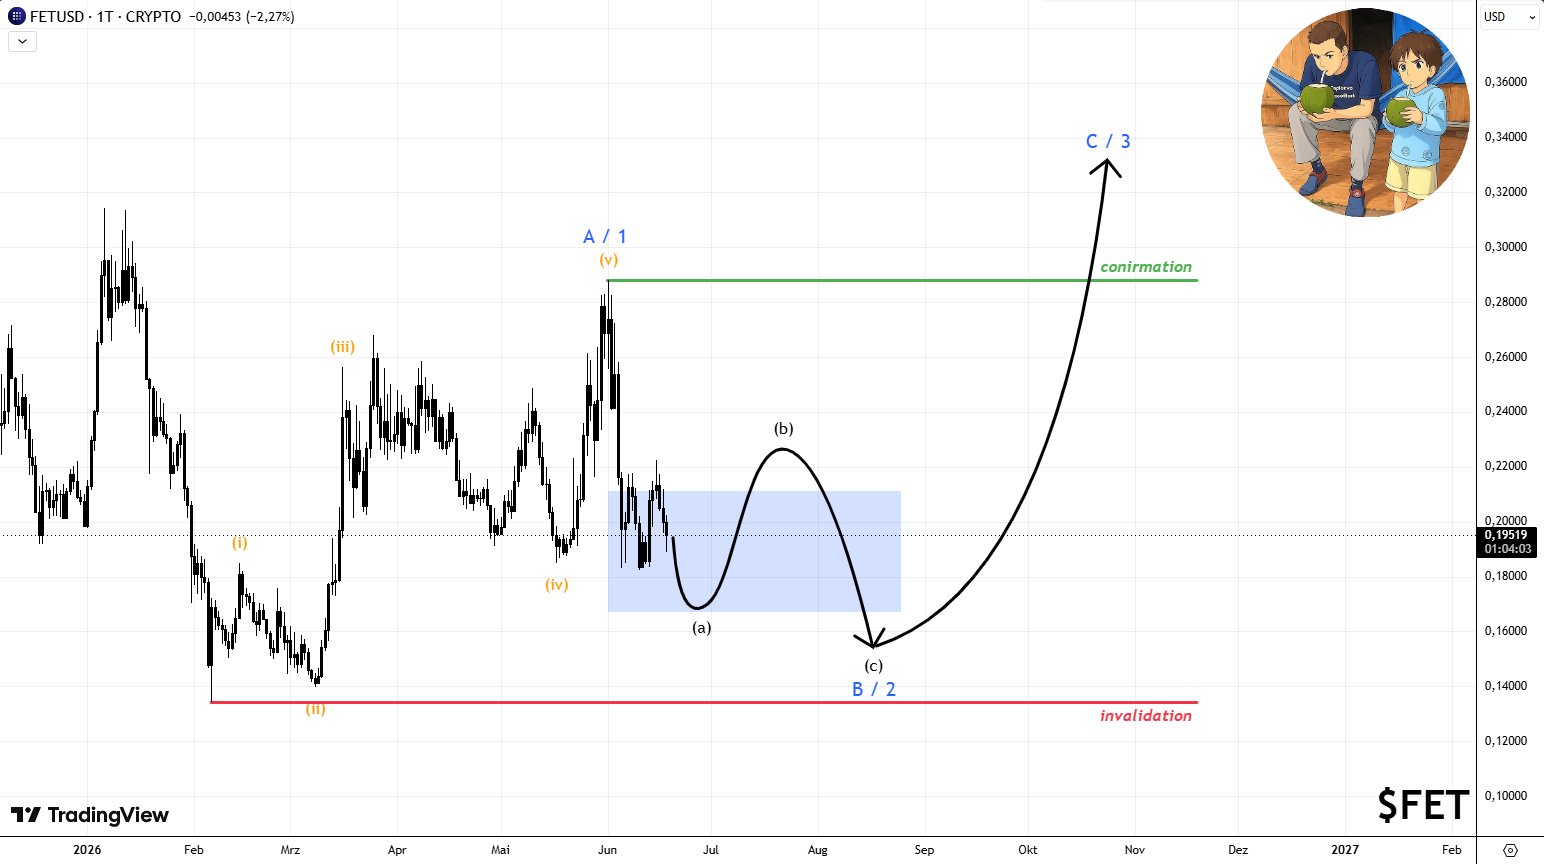
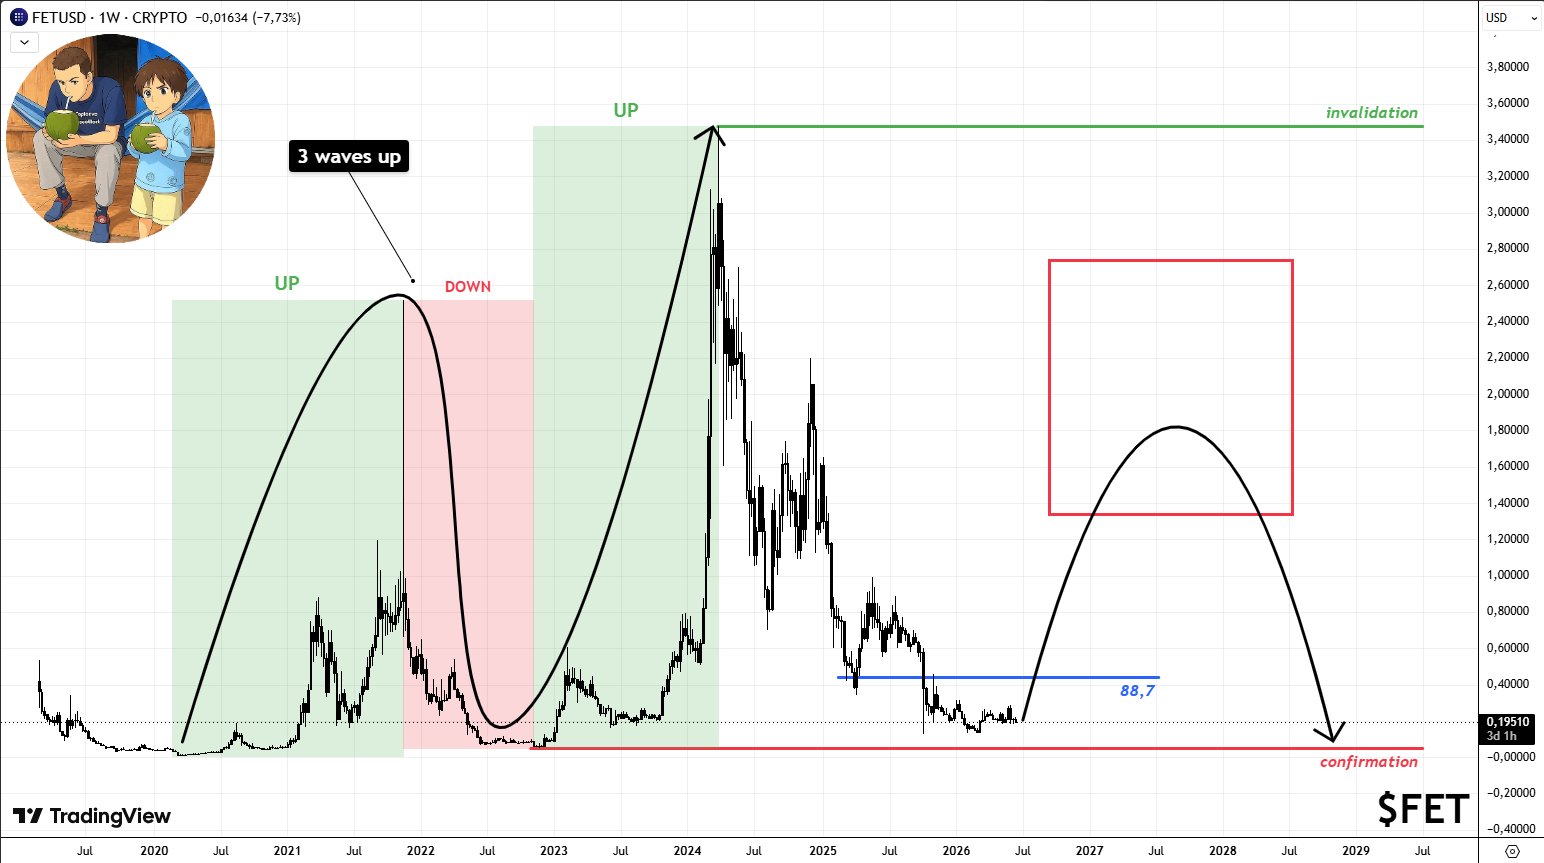
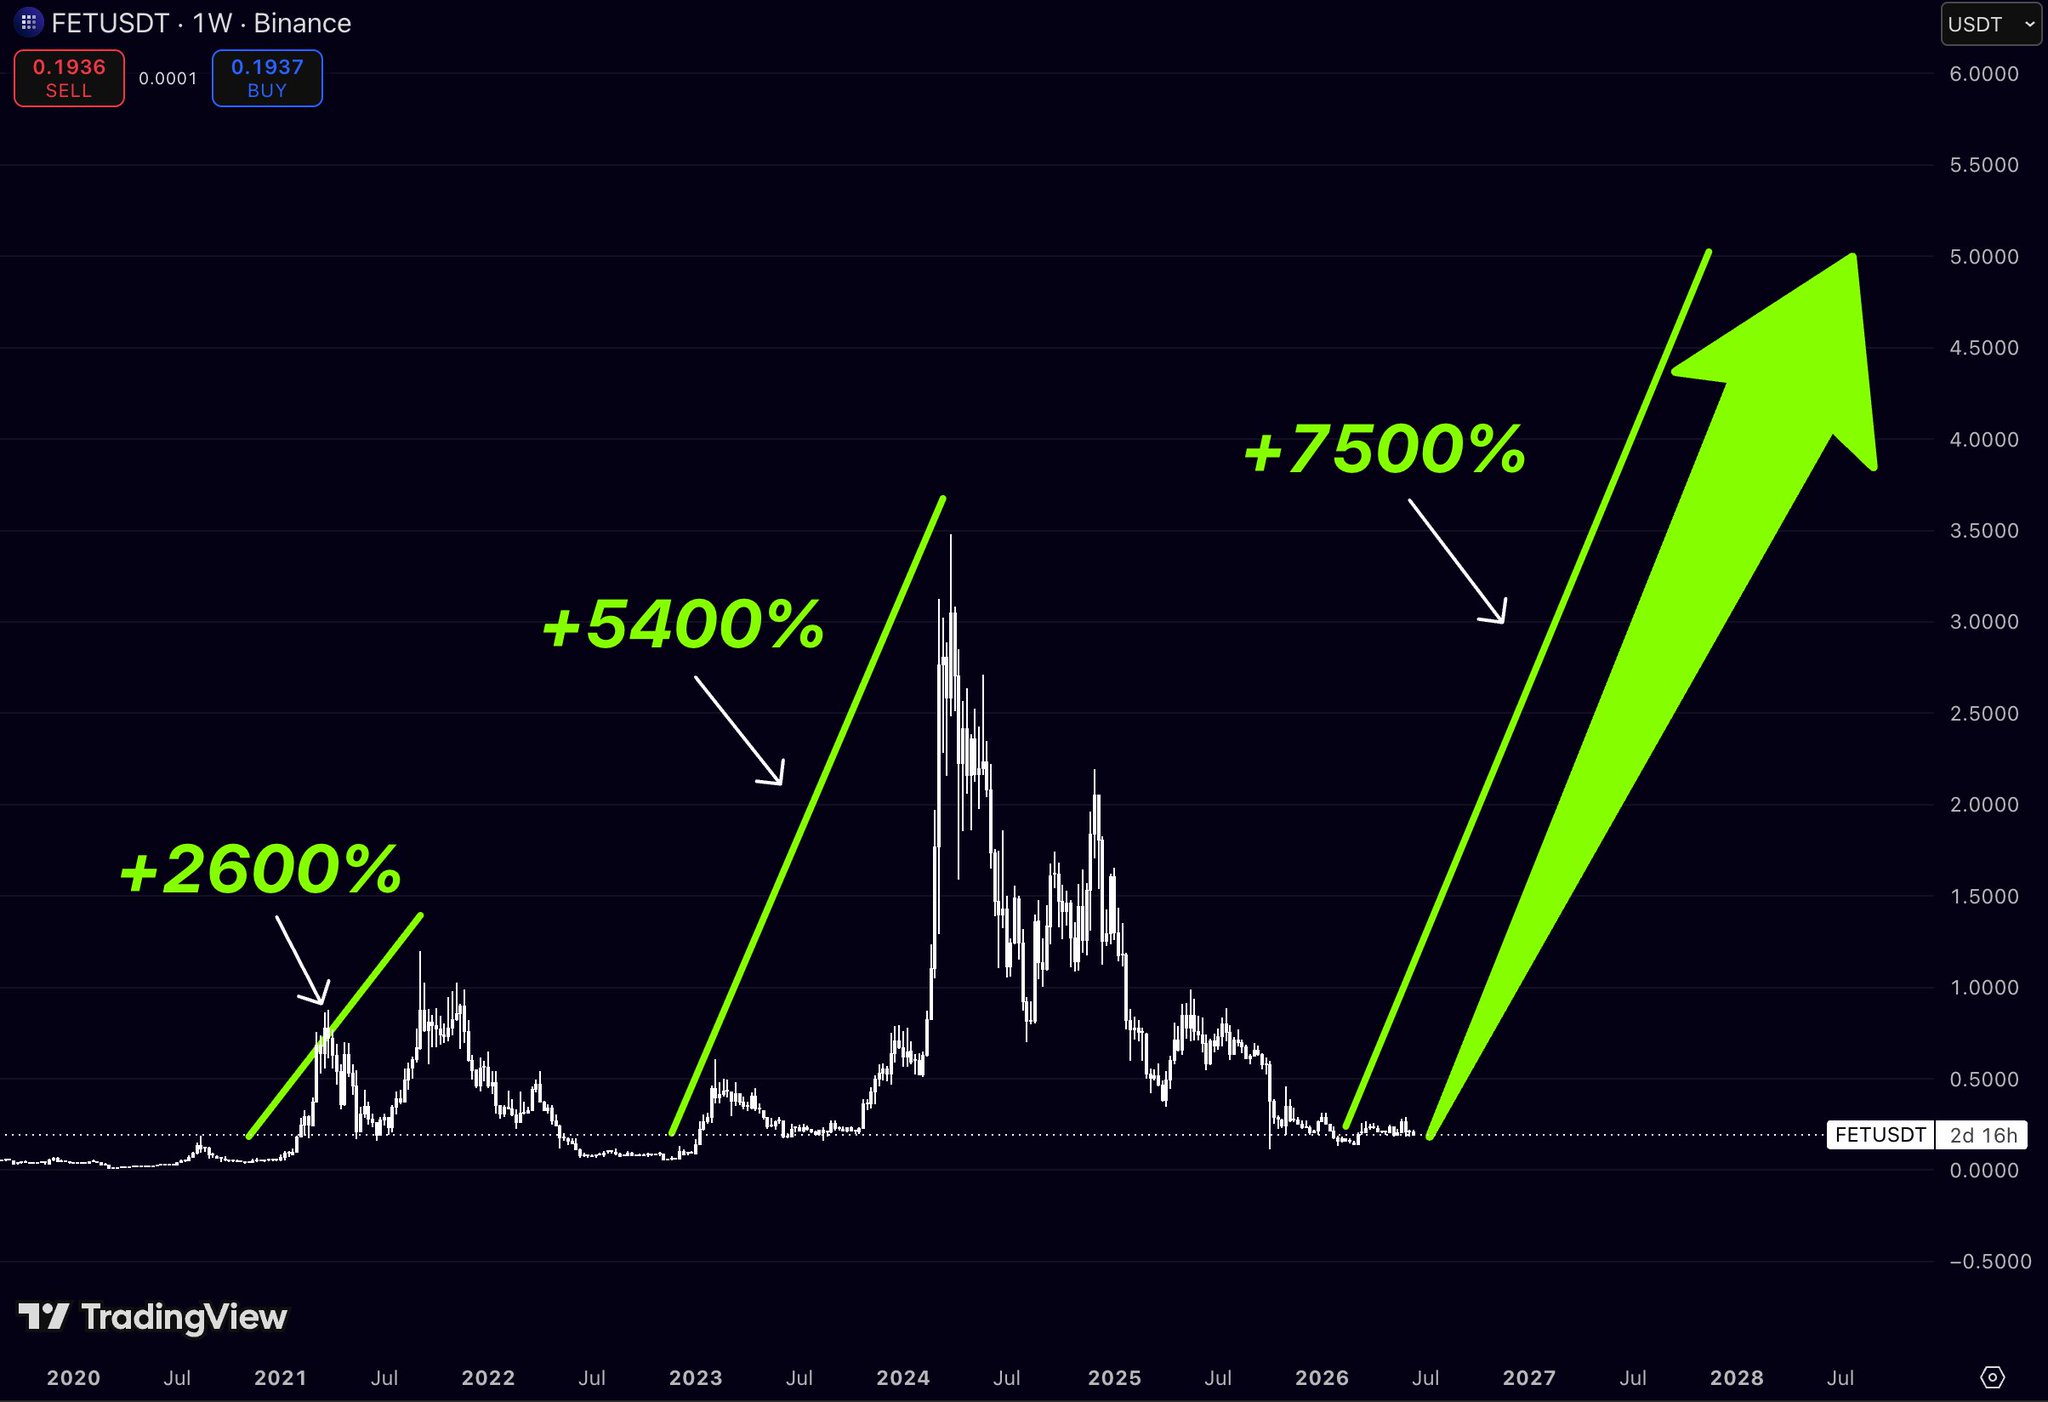
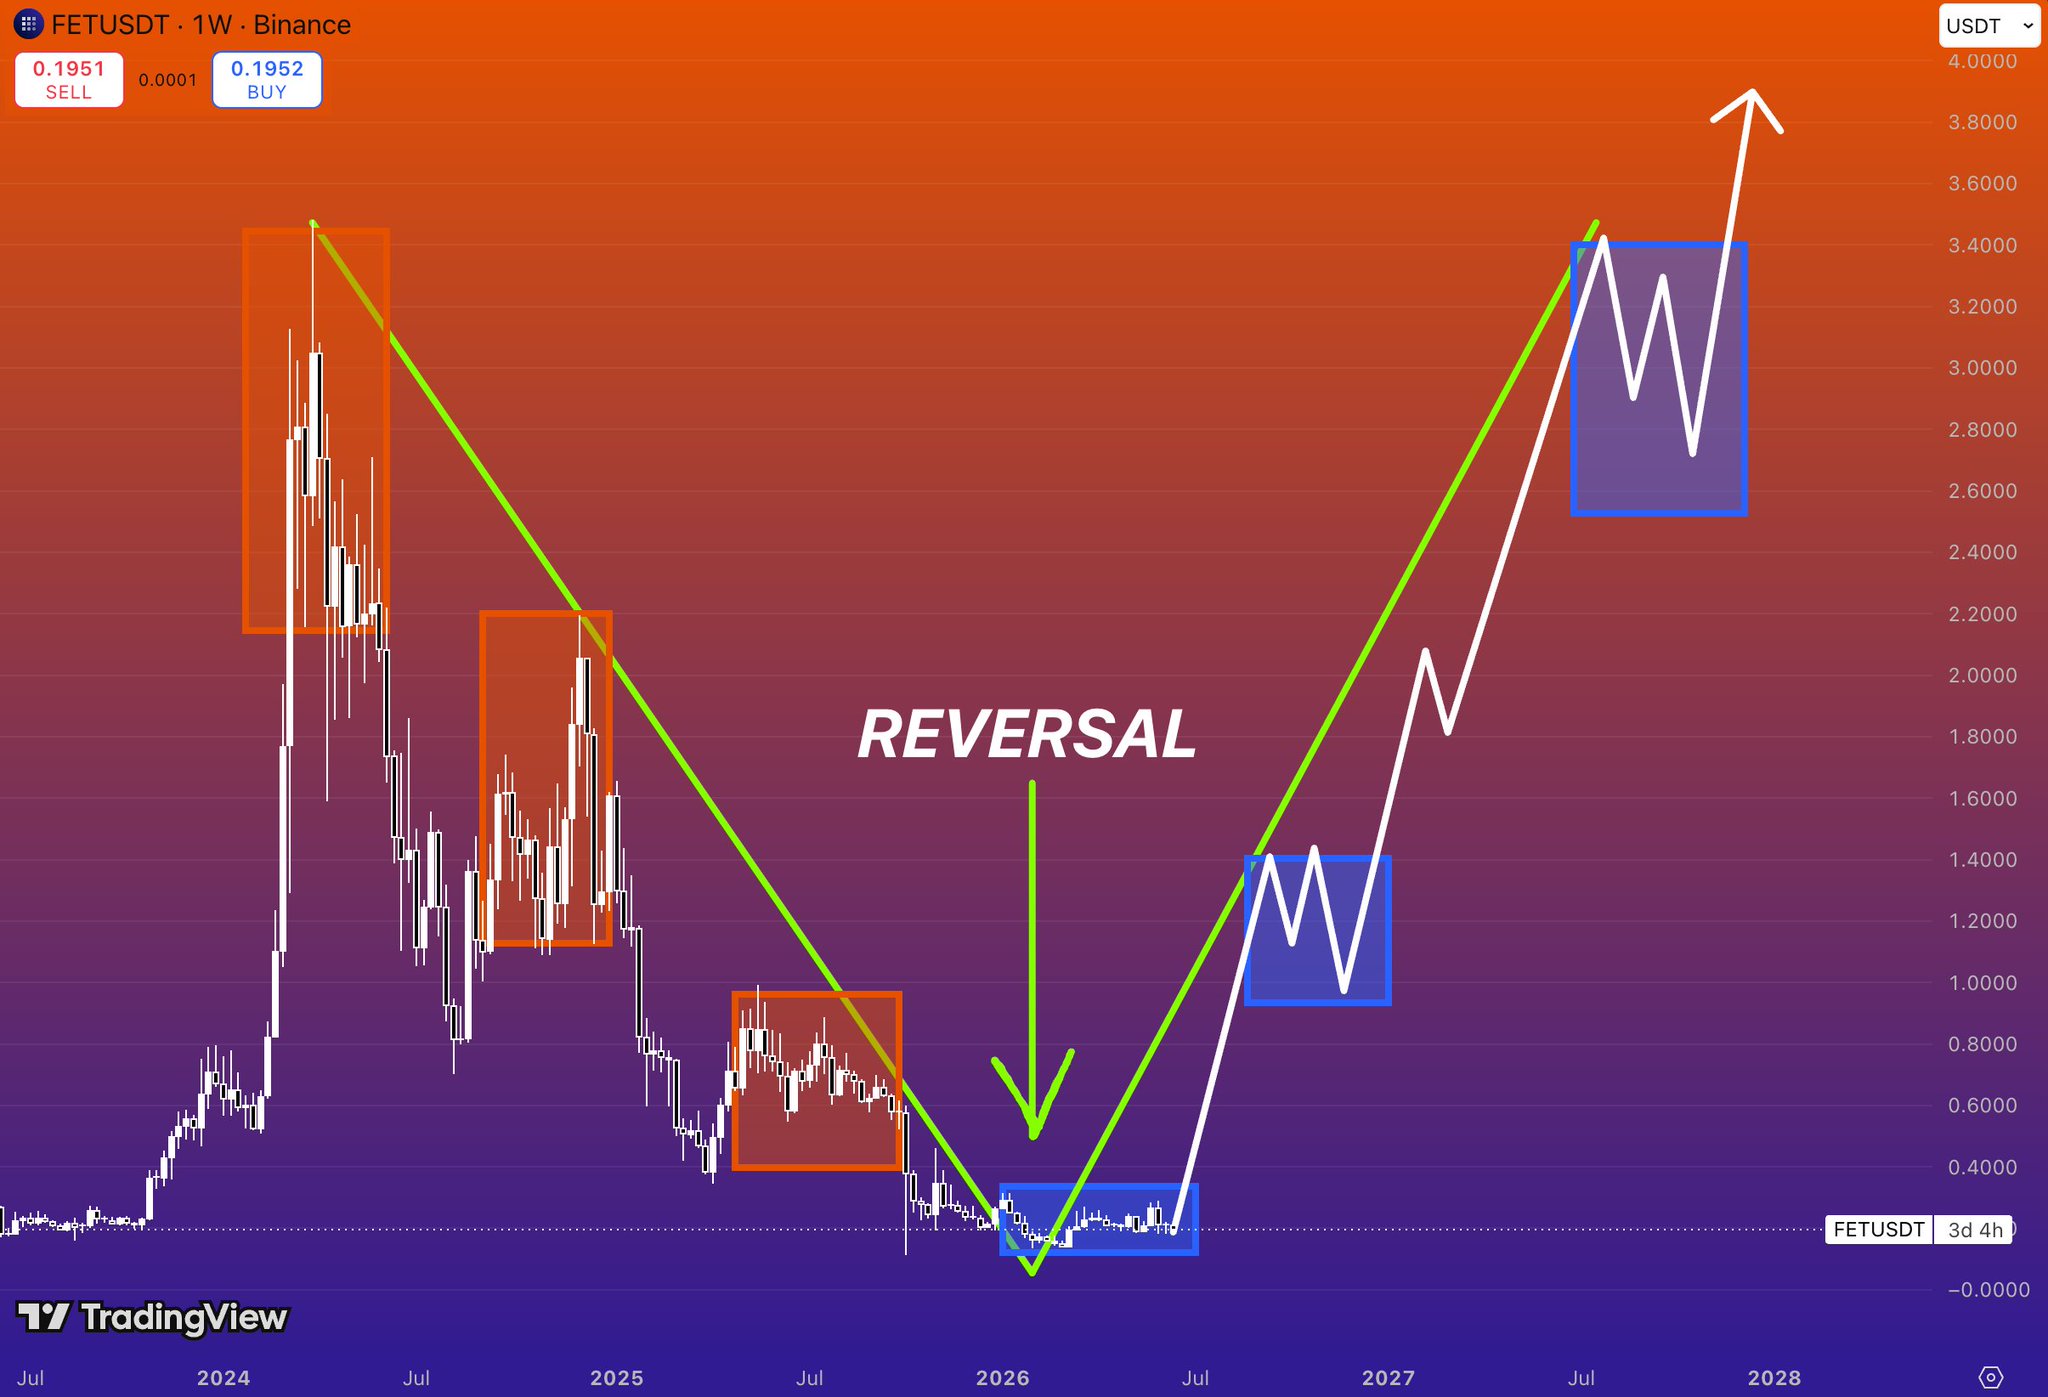
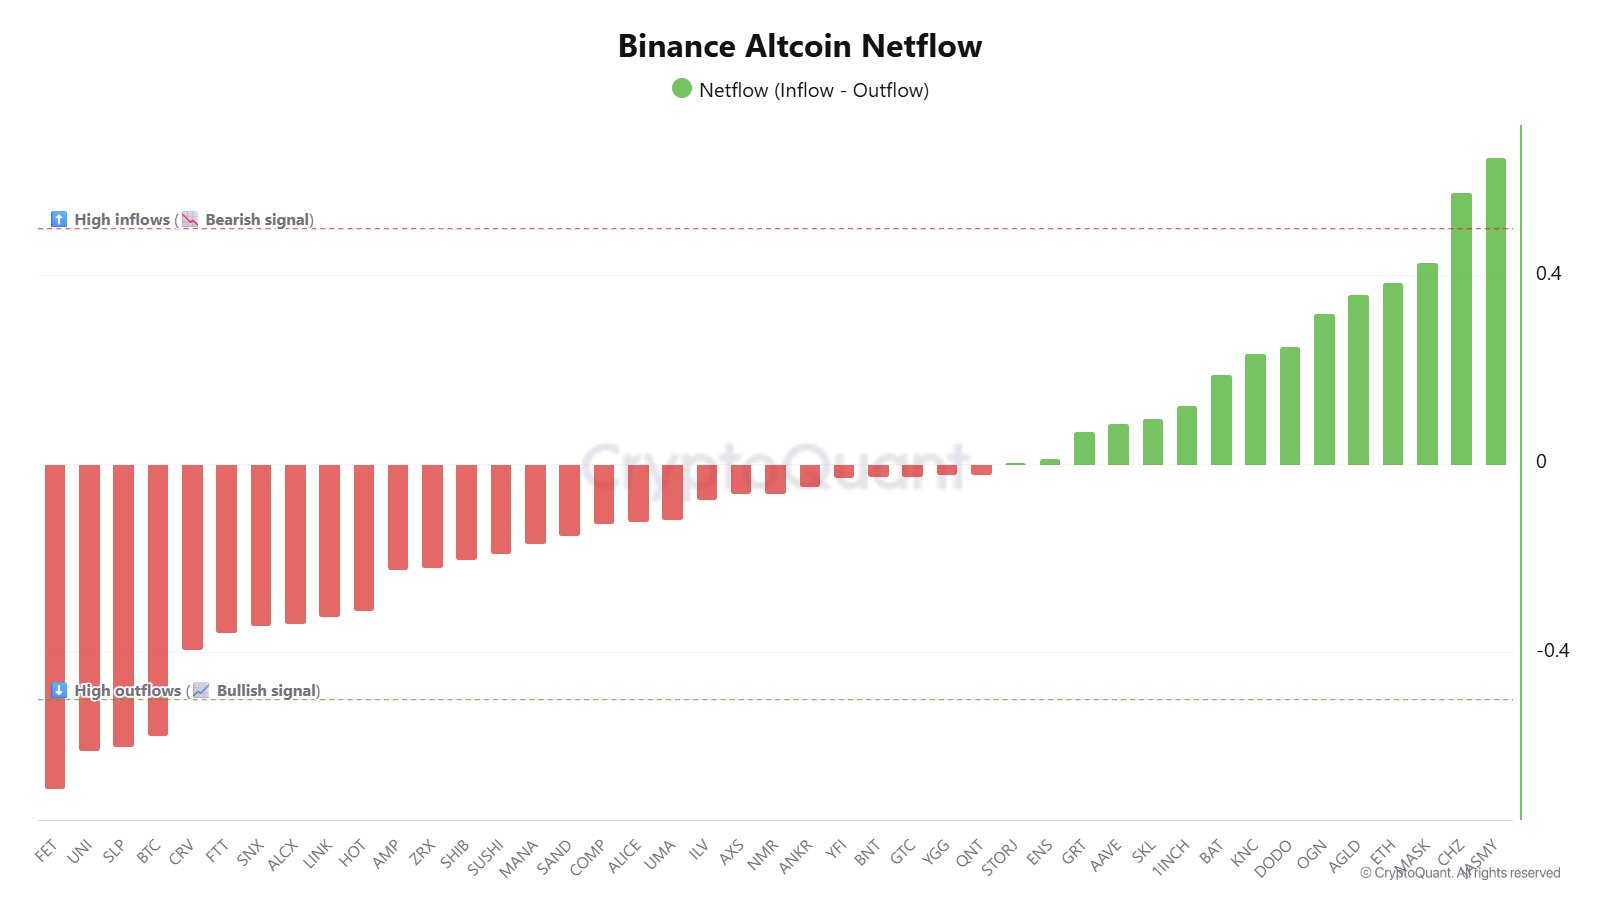
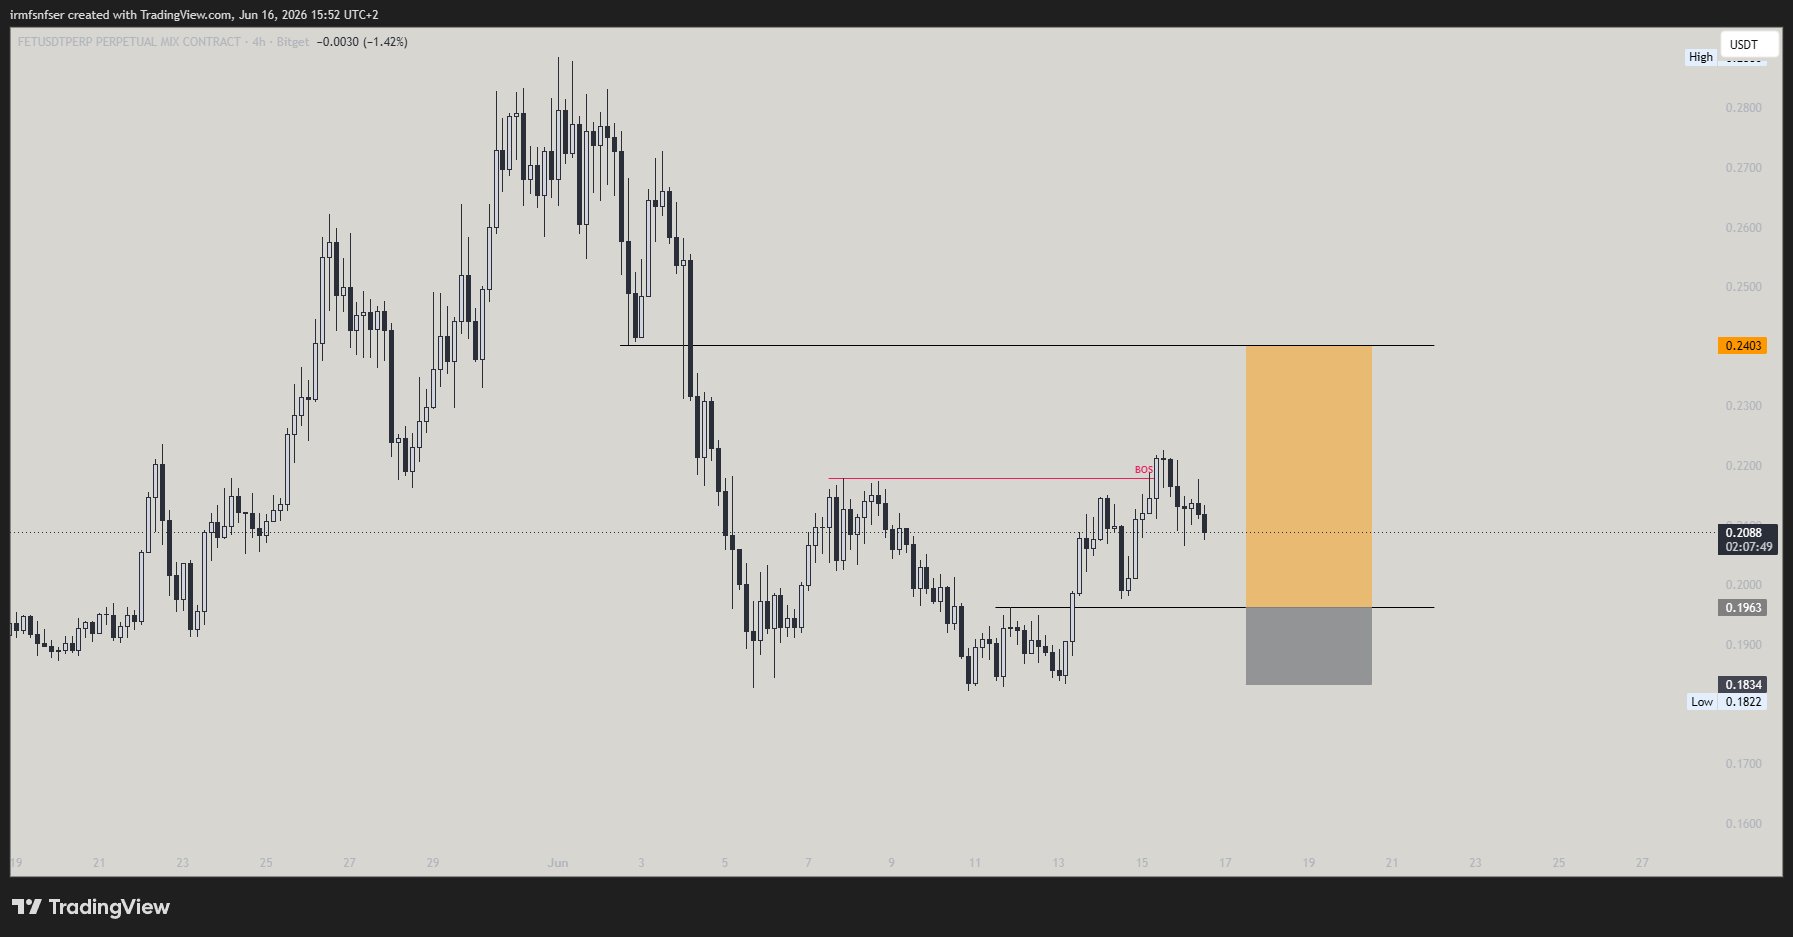
- Xu hướng của FET sau khi phát hànhGiảm giá
- Xu hướng của FET sau khi phát hànhTăng giá
- Xu hướng của FET sau khi phát hànhTăng giá
- Xu hướng của FET sau khi phát hànhCực kỳ lạc quan
- Xu hướng của FET sau khi phát hànhTăng giá
- Xu hướng của FET sau khi phát hànhTăng giá
- Xu hướng của FET sau khi phát hànhTrung tính
 Abundance | Capital Rotation TA_Analyst Trader S8.47K @mr_abundance_
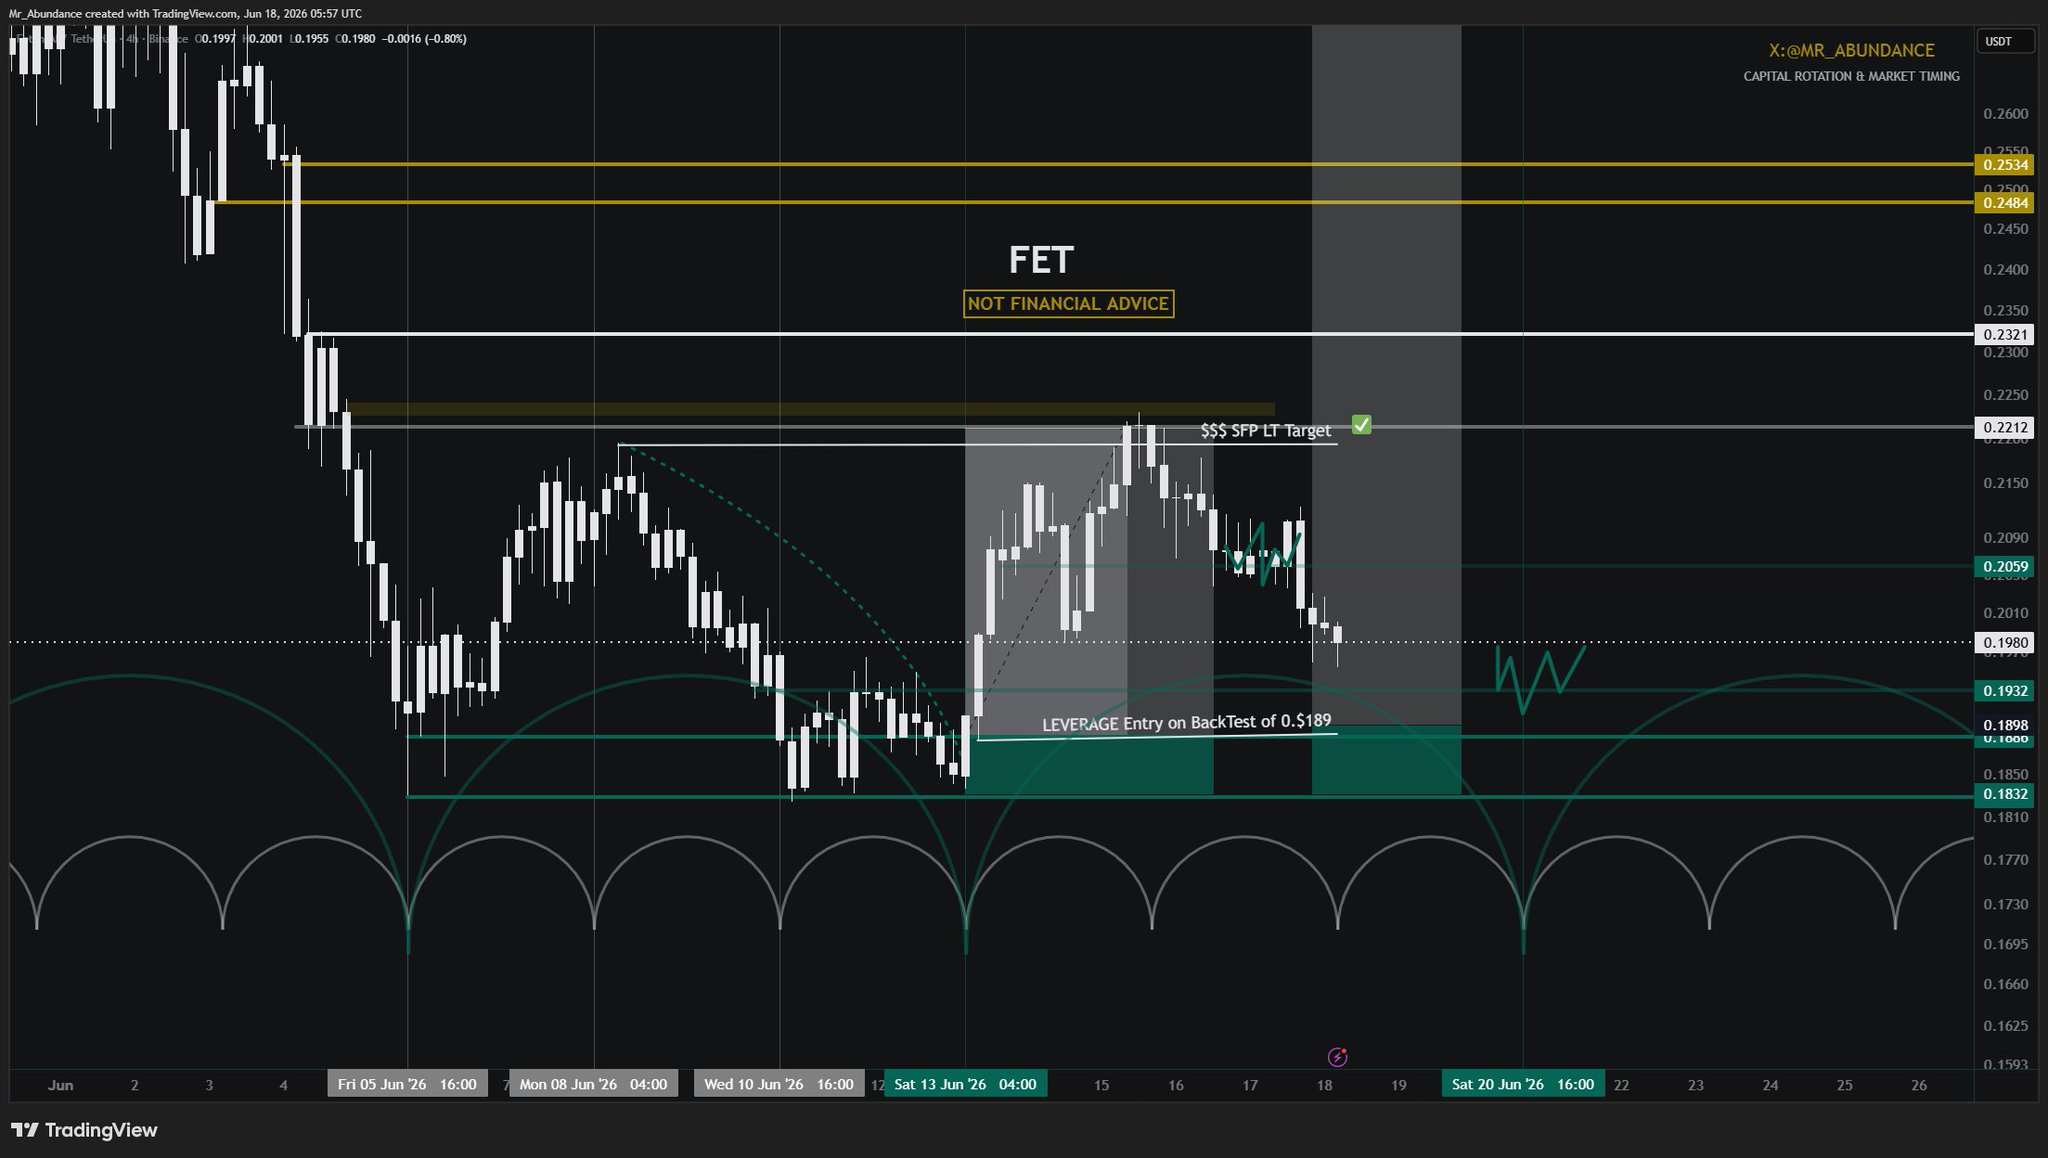 Abundance | Capital Rotation TA_Analyst Trader S8.47K @mr_abundance_
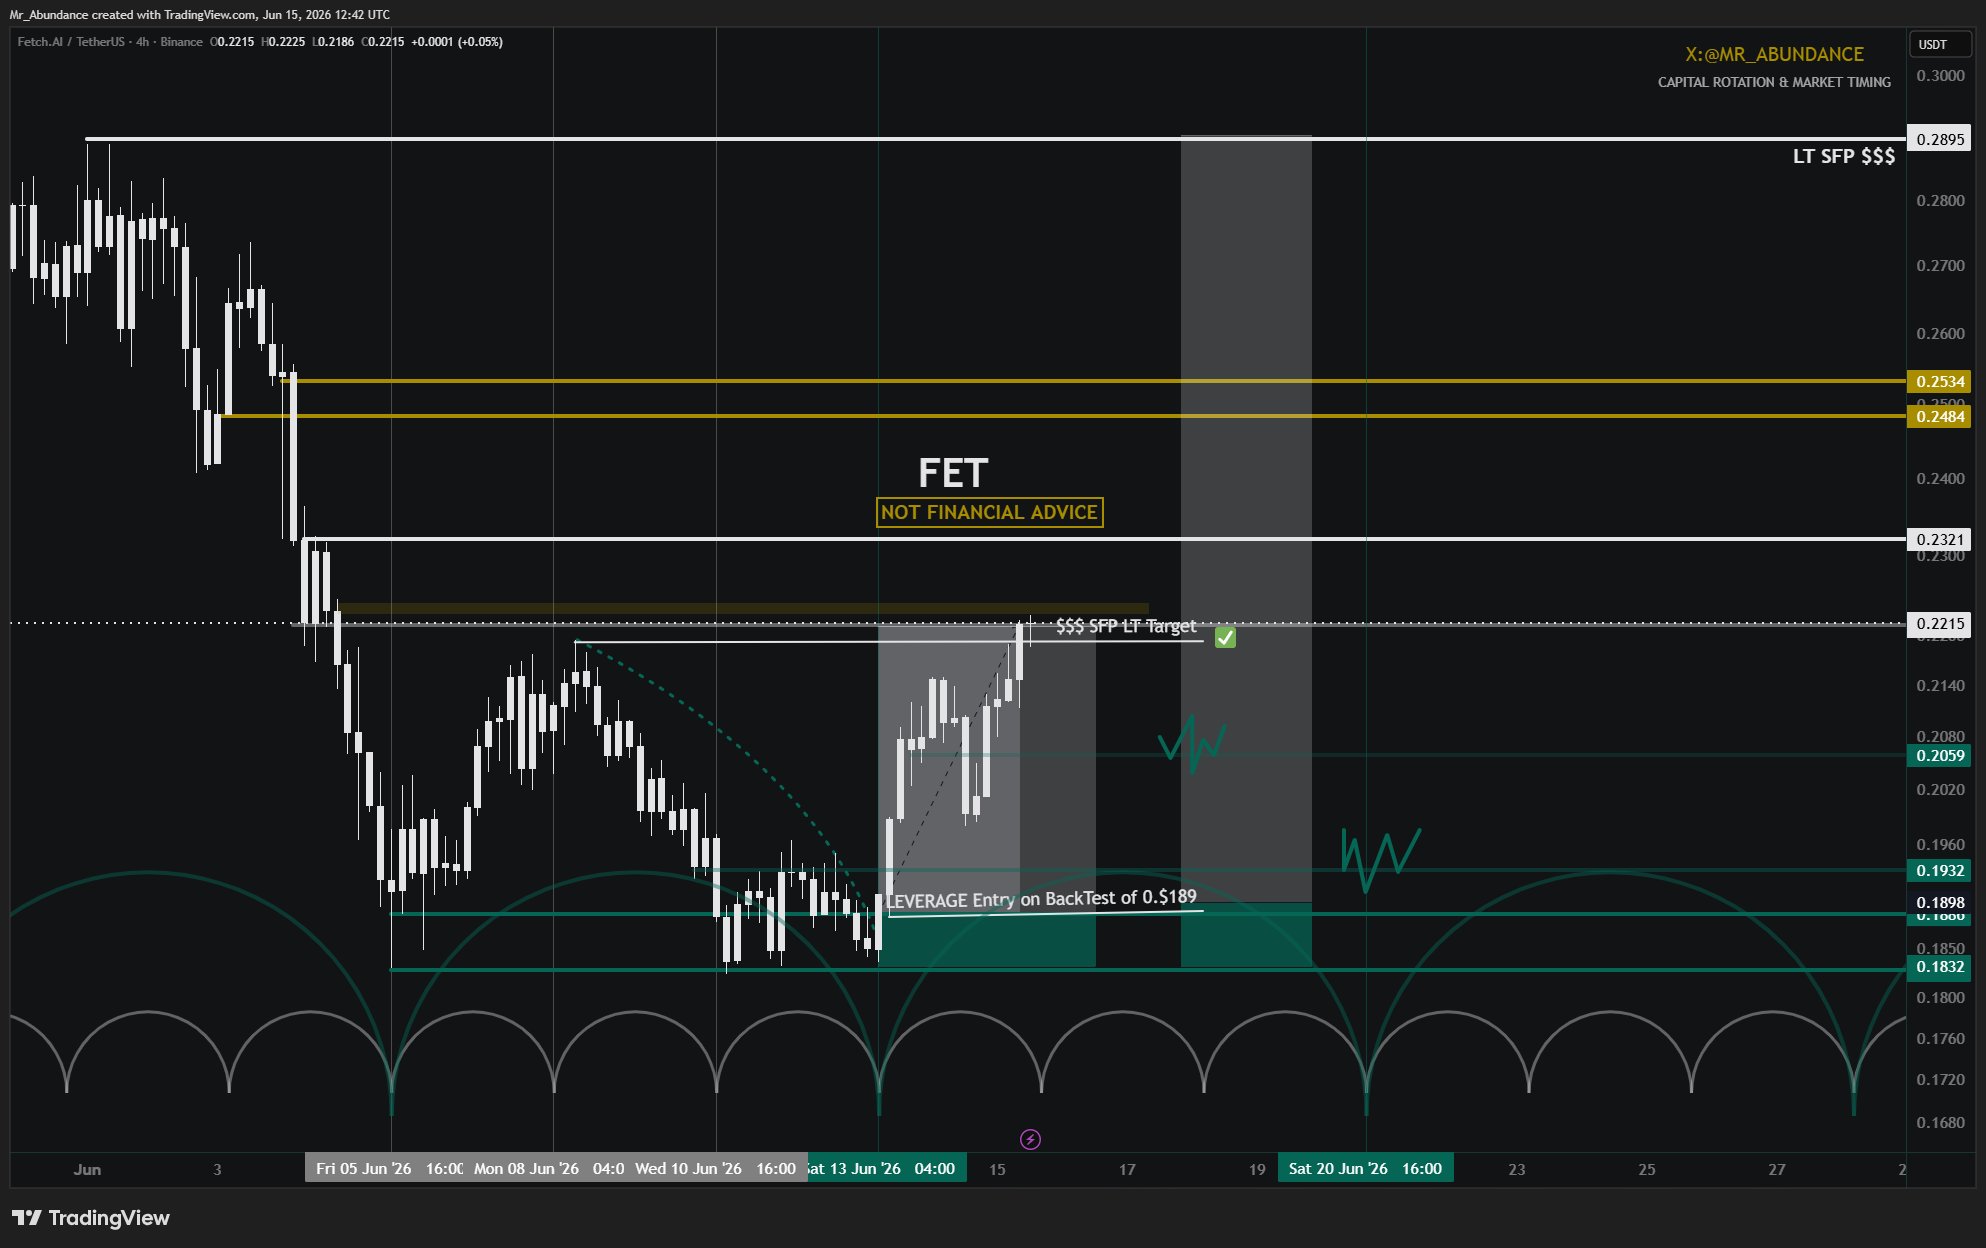 67 1 6.17K Gốc >Xu hướng của FET sau khi phát hànhGiảm giá
- Xu hướng của FET sau khi phát hànhTăng giá
- Xu hướng của FET sau khi phát hànhTrung tính