口座開設
QRコードでアプリをダウンロードする
iOS & Android

Global X Uranium ETF (Derivatives) (URA)

$
$ 47.27 (URA/USD)
-1.62%
24H

Global X Uranium ETF (Derivatives) URA 価格履歴 USD

Global X Uranium ETF (Derivatives)の今日、7日間、30日間、90日間の価格を追跡
期間
24H変動幅
24H変動率 (%)
本日
$ 0.77
-1.62%
7日
$ 2.74
5.97%
30日
$ 0.21
-0.45%
90日
$ 1.87
4.00%

URAを今すぐ所有

BitMartでURAを簡単に安全に売買できます。
今すぐURAを購入/売却
今すぐ{0}を購入/売却
Global X Uranium ETF (Derivatives) 相場情報
最終取引価格 $ 47.27
$ 47.26 24H変動幅 $ 48.61
過去最高値
‎$ 61.31‎
過去最安値
‎$ 42.38‎
24H変動幅
‎-1.62%‎
24H取引高
‎$ 0‎
供給量
0.00 URA
時価総額
‎$ 0‎
最大供給量
--
完全希薄化後時価総額
‎$ 0‎
取引 URA

稼ぐ

眠っている暗号資産を活用し、セービングやステーキングで安定収益を獲得。
今すぐ試す
今すぐ試す

Global X Uranium ETF (Derivatives) Xインサイト

avatar
URA shifted from bullish to extremely bearish, and the chart shows the price has broken below a key support level.

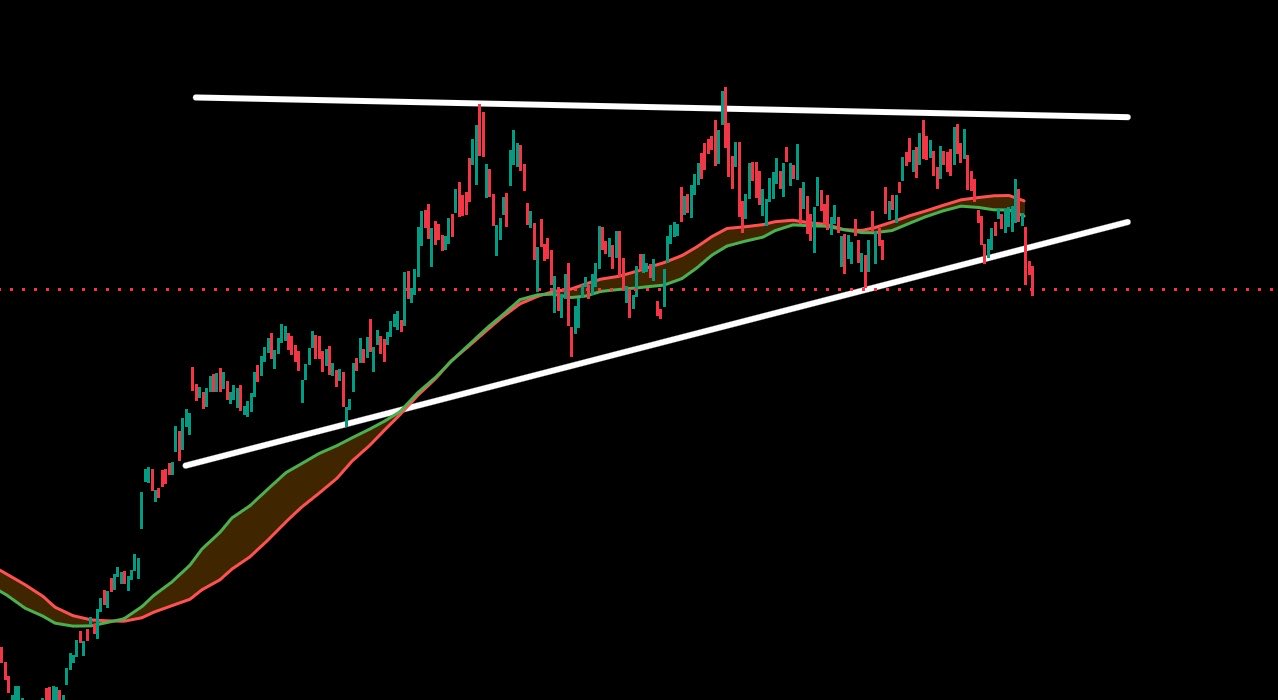
URA which I thought looked crazy bullish now looks crazyyyy bearish. My god @TgMacro brutal. https://t.co/kn6awg7zTa

view 0
view 0
view 98
2026-06-09 15:37
リリース後のURAのトレンド
非常に弱気
URA shifted from bullish to extremely bearish, and the chart shows the price has broken below a key support level.
avatar
URA has made a good rebound from the lower boundary of the ascending triangle, with a target price of $82.
avatar

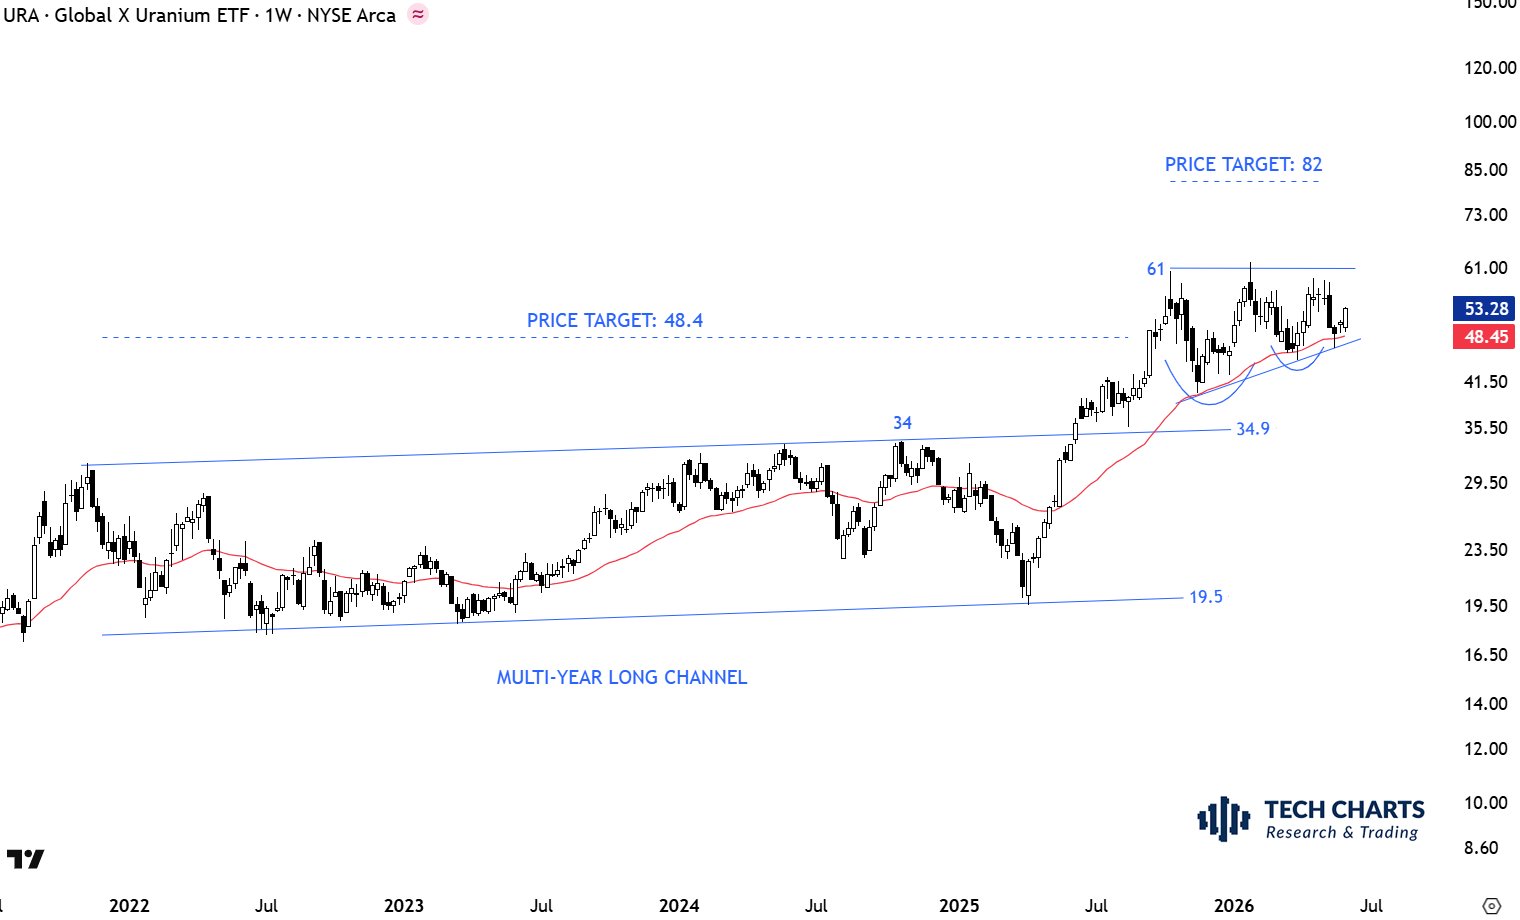
So far this has been a good rebound from the lower boundary of the #ascending triangle. $URA https://t.co/eXVEbpHwMP

view 228
view 5
view 33.7K
2026-06-02 16:58
リリース後のURAのトレンド
強気
URA has made a good rebound from the lower boundary of the ascending triangle, with a target price of $82.
avatar
URA has bottomed and is bouncing back; the author is bullish on its rise to $56, with a short-term target of $45.

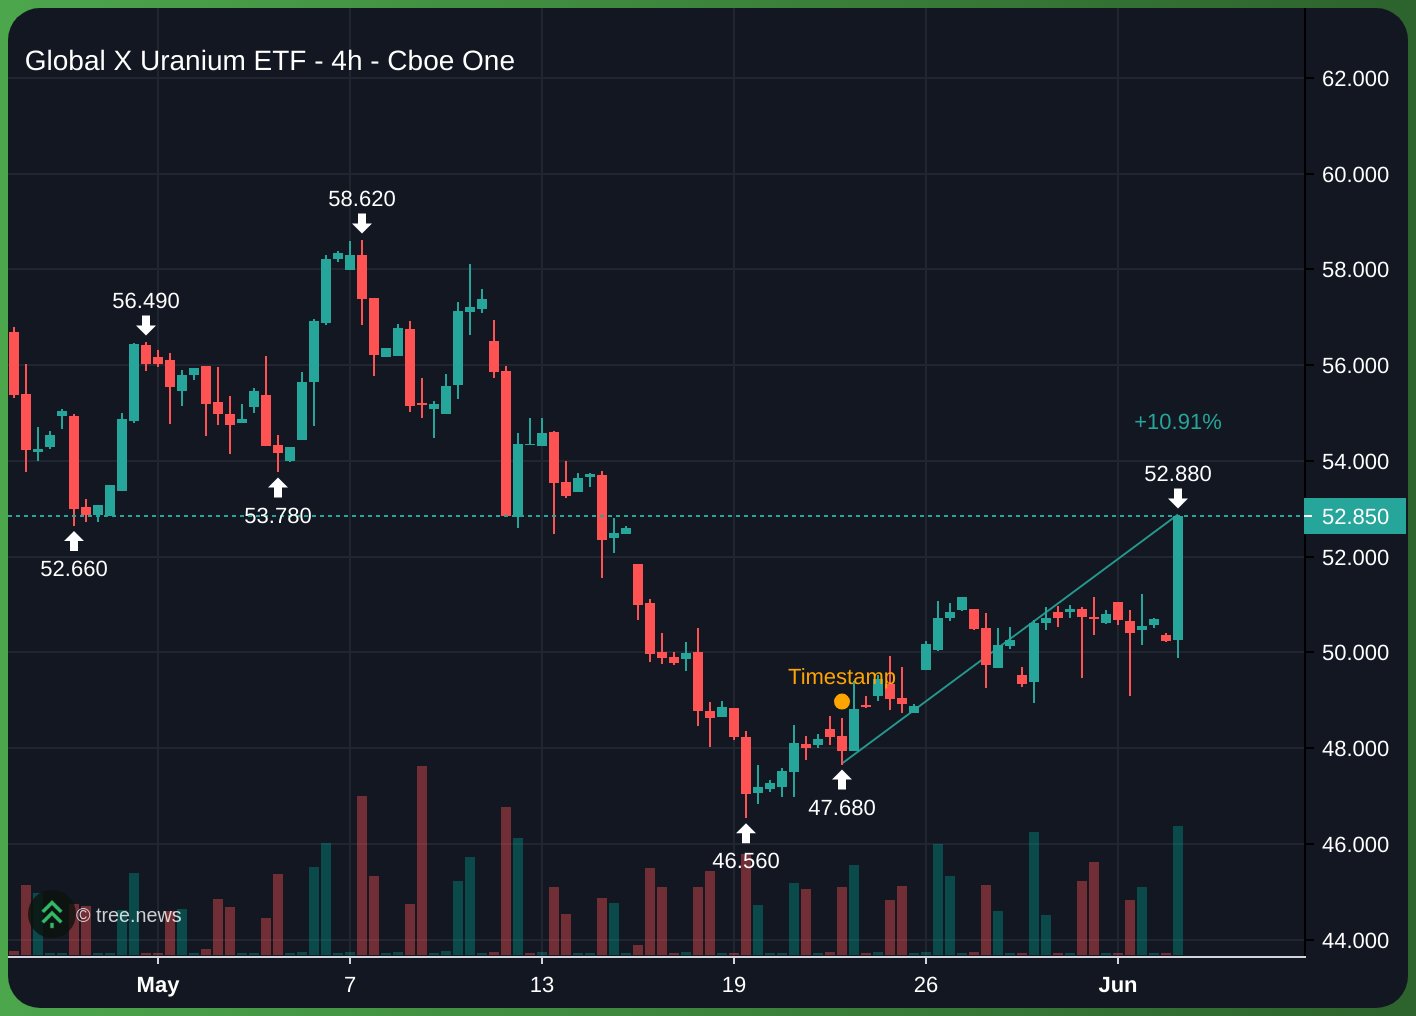
$URA buys doing nicely.

56 is first target for me. https://t.co/pKCvFKqJhu
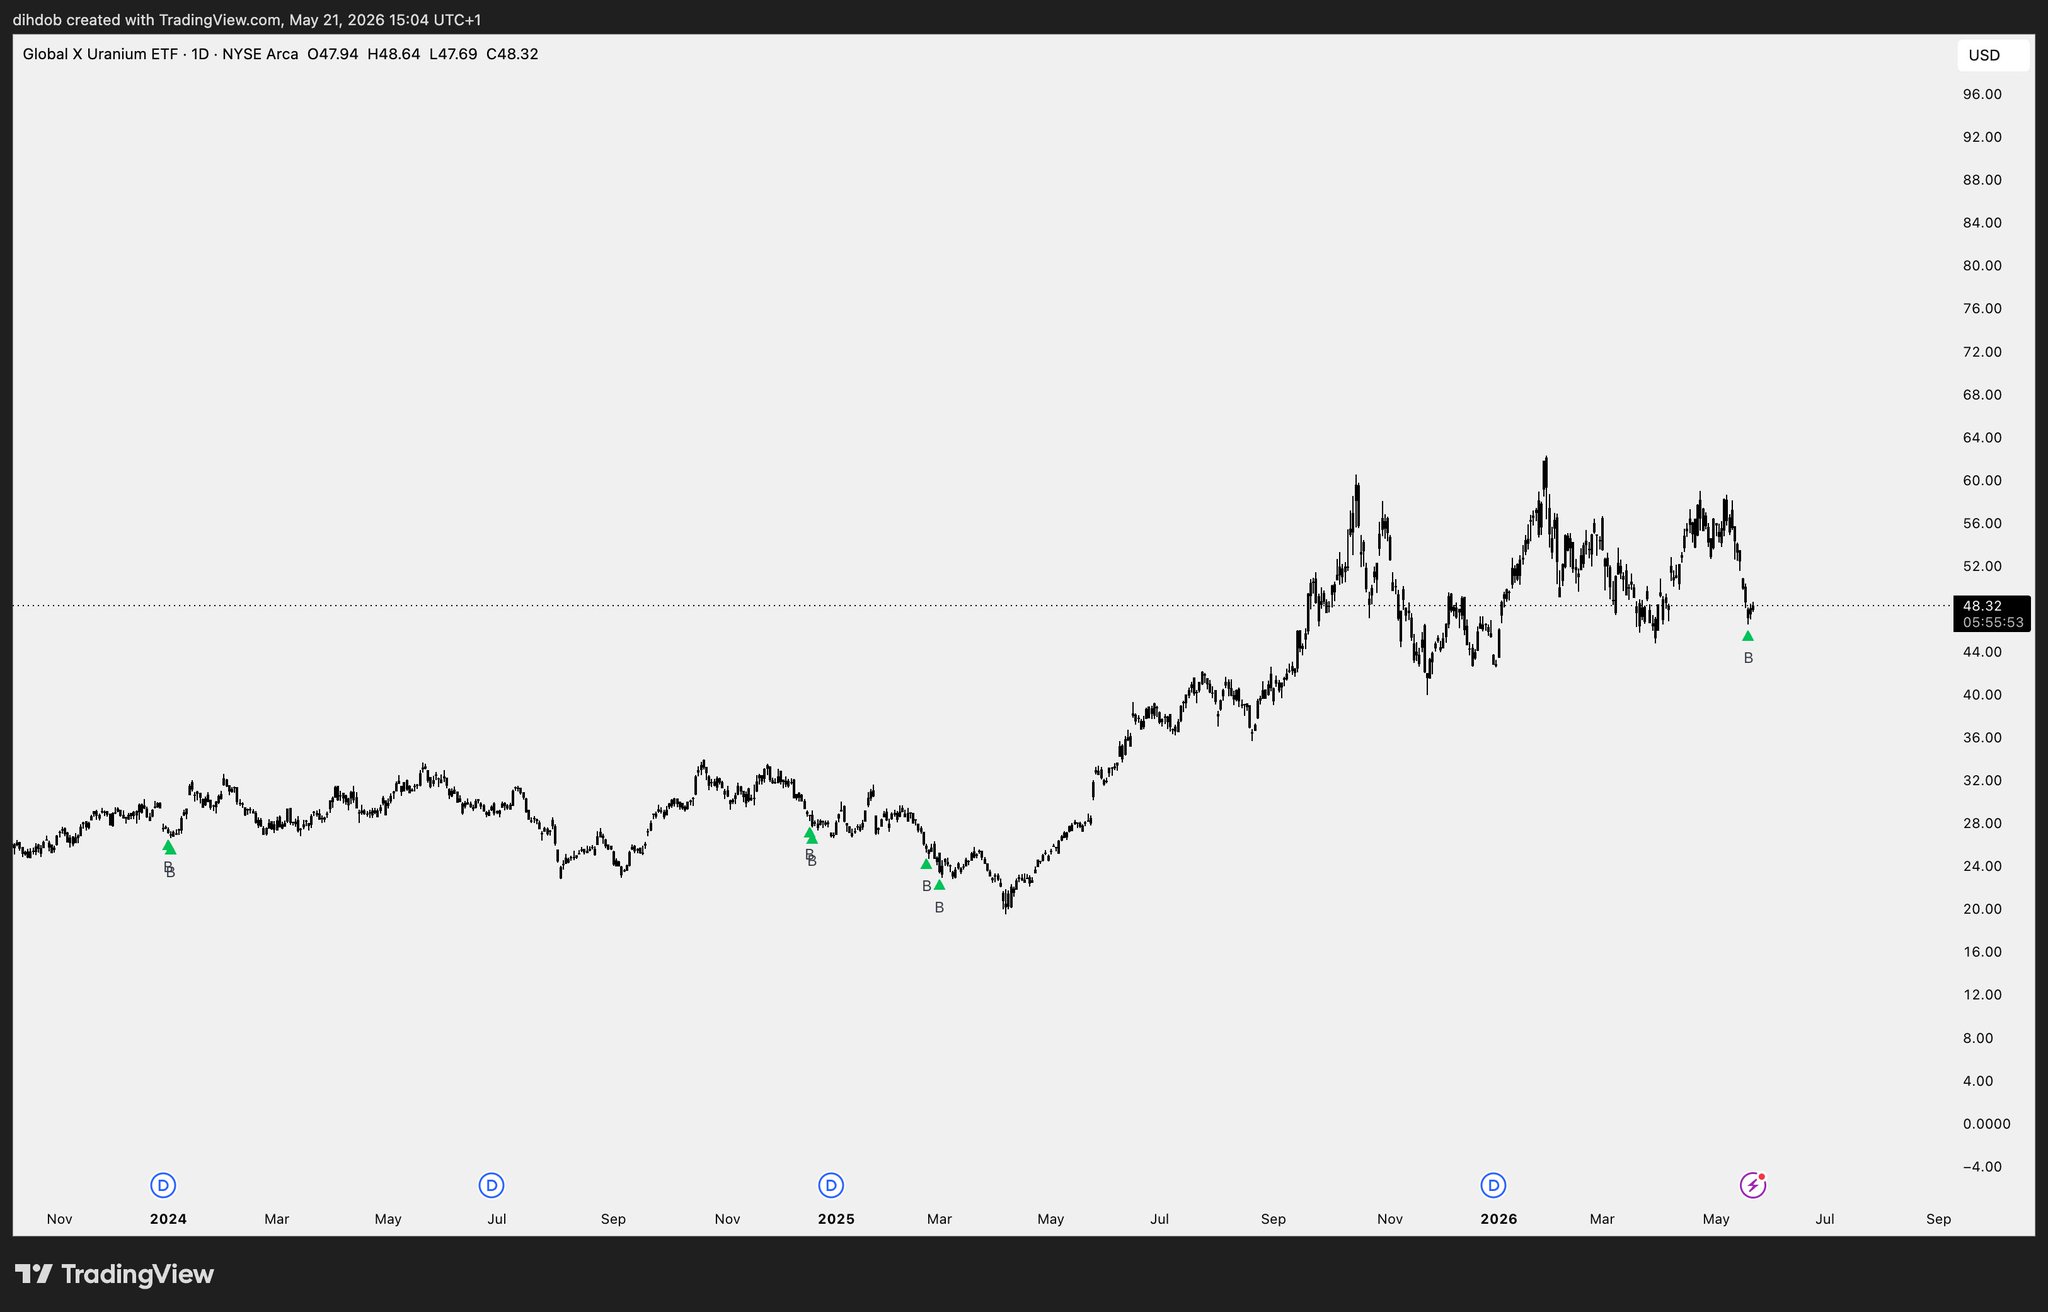
avatar

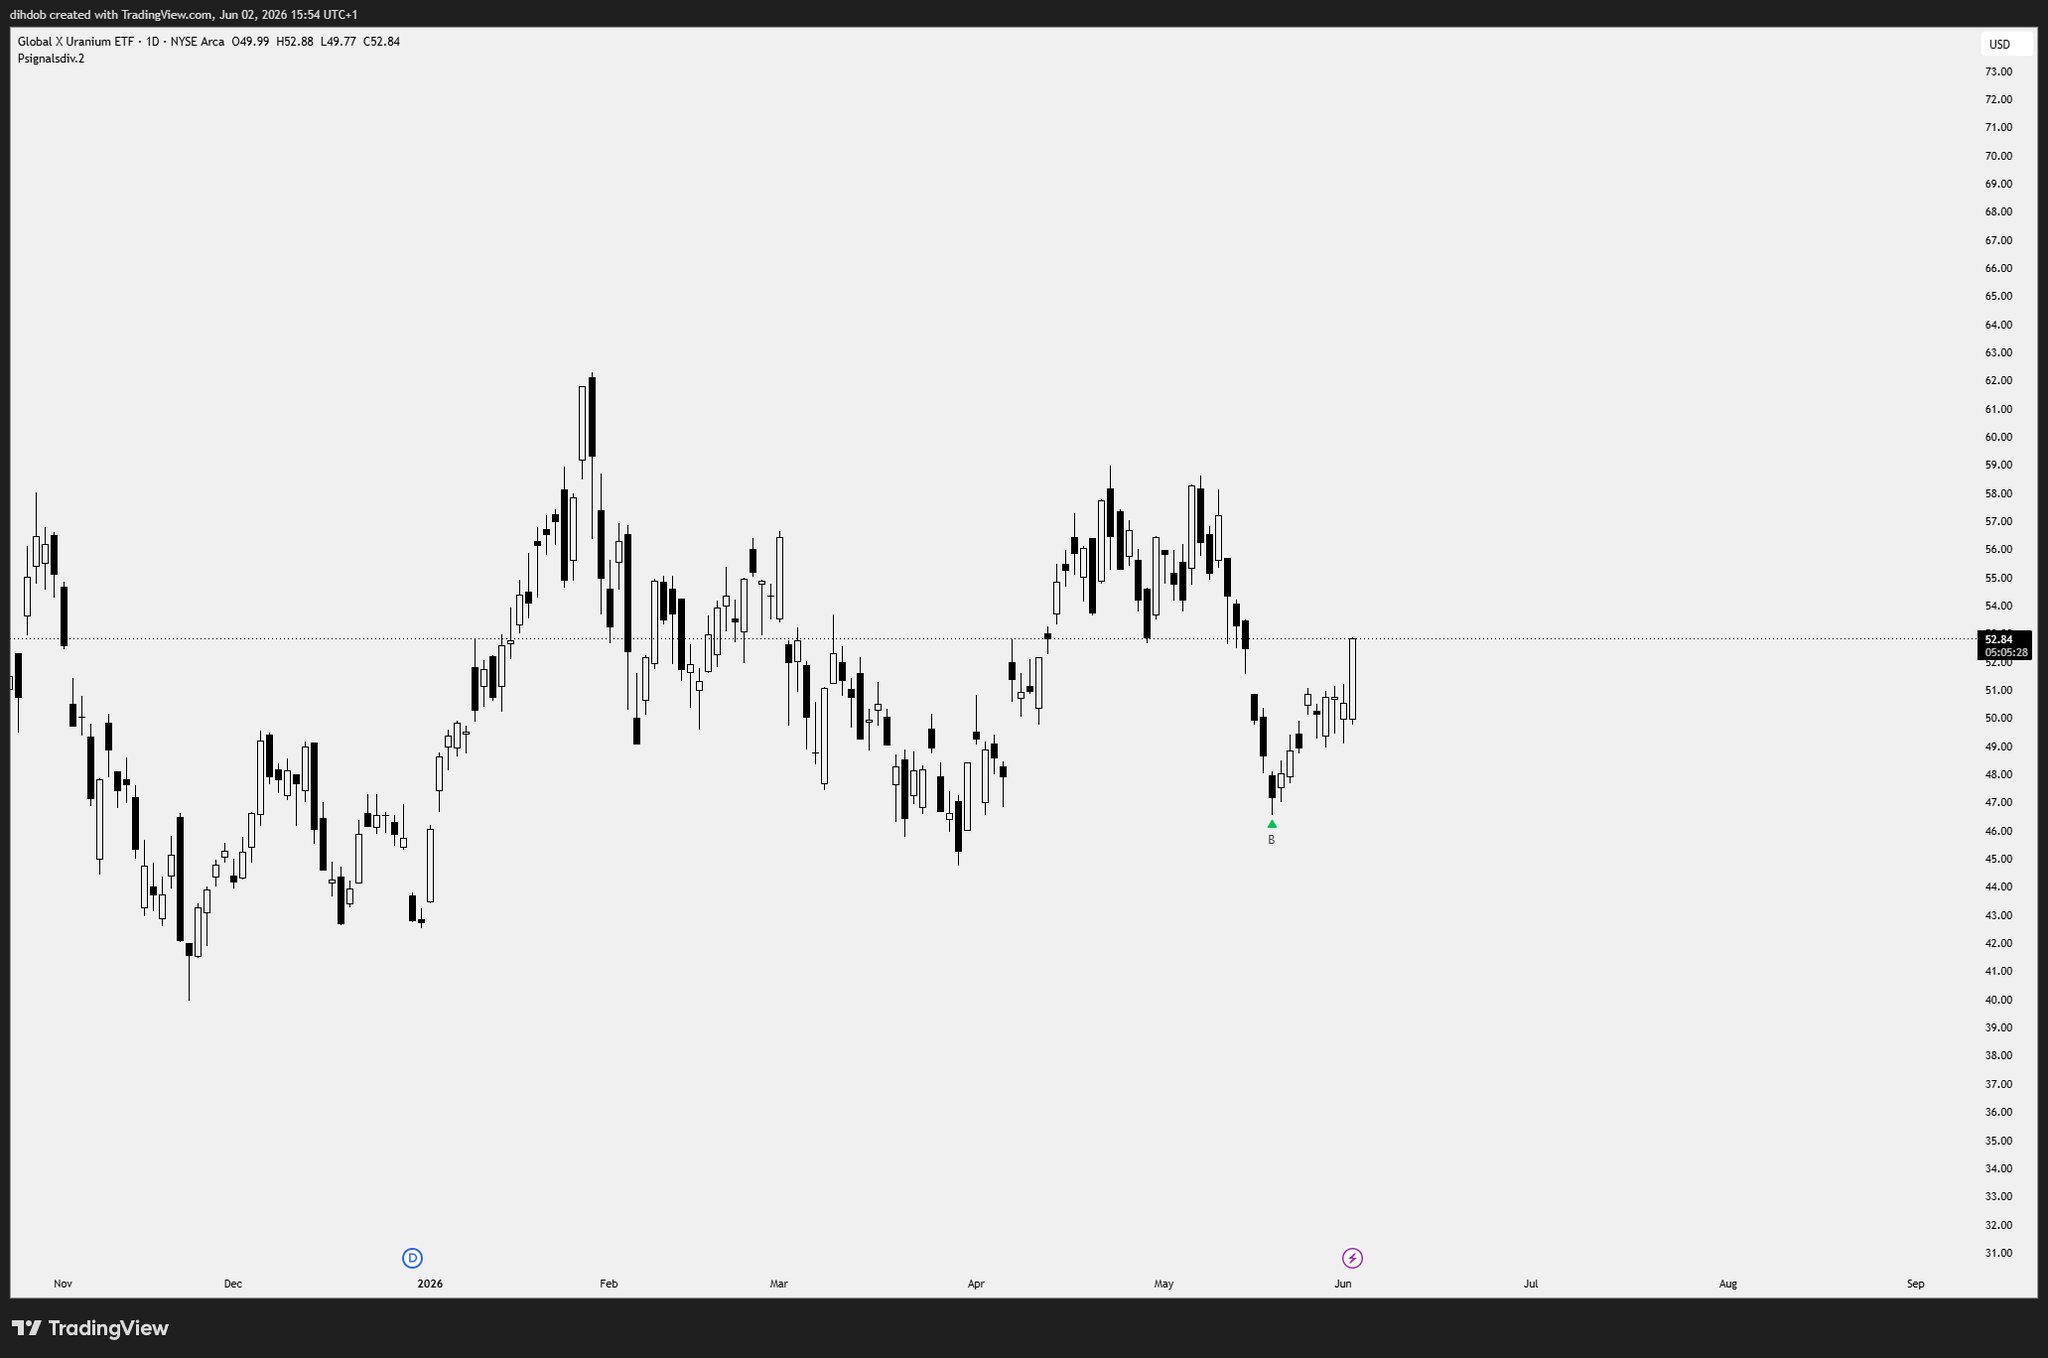
Betting on a $URA bottom from here into 45 for a bit of relief. https://t.co/tynobePum4

view 9
view 2
view 1.9K
2026-06-02 14:57
リリース後のURAのトレンド
強気
URA has bottomed and is bouncing back; the author is bullish on its rise to $56, with a short-term target of $45.
詳細確認

価格予測

URAを購入するのに良い時期はいつですか?URAは今買いでしょうか、売りでしょうか?

Global X Uranium ETF (Derivatives)(URA)を購入または売却する適切な時期を決定する際は、まずご自身の取引戦略とリスクプロファイルに合わせることが重要です。長期投資家と短期トレーダーは市場状況を異なる方法で解釈することが多いため、決定には個人的なアプローチを反映すべきです。 最新の URA 4時間テクニカル分析によると、現在の取引シグナルは ホールド です。 最新のURA1日テクニカル分析によると、現在のシグナルはホールドです。
55
ホールド
URAの4時間テクニカル分析
最終更新 2026-06-22 15:59:59
48
ホールド
URAの1日間テクニカル分析
最終更新 2026-06-21 23:59:59
beacon

ビーコン予測

の確率的価格予測(今後24時間)
i
ビーコン予測に関する免責事項
このページに表示されるデータ結果は、選択した取引ペアの実際の取引データ(OHLCV)と対応するテクニカル指標に基づいて分析されています。
この予測は実験的な技術的成果であり、あくまで参考目的で提供しています。これは投資アドバイスをではありません。現実世界での予期せぬ出来事が市場行動に大きな影響を与える可能性があります。トレーダーは慎重に意思決定を行うべきです。
アプリバージョン Global X Uranium ETF (Derivatives)
Global X Uranium ETF (Derivatives) (URA) is a cryptocurrency . Global X Uranium ETF (Derivatives) has a current supply of 0. The last known price of Global X Uranium ETF (Derivatives) is 47.87169825 USD and is down -2.83 over the last 24 hours. It is currently trading on 2 active market(s) with $0.00 traded over the last 24 hours.
続きを読む