ALTCOINS IN A DANGEROUSLY BULLISH SETUP.
Just like it was after FTX Crash 👀
This gets even better when we see some bottomed charts like :
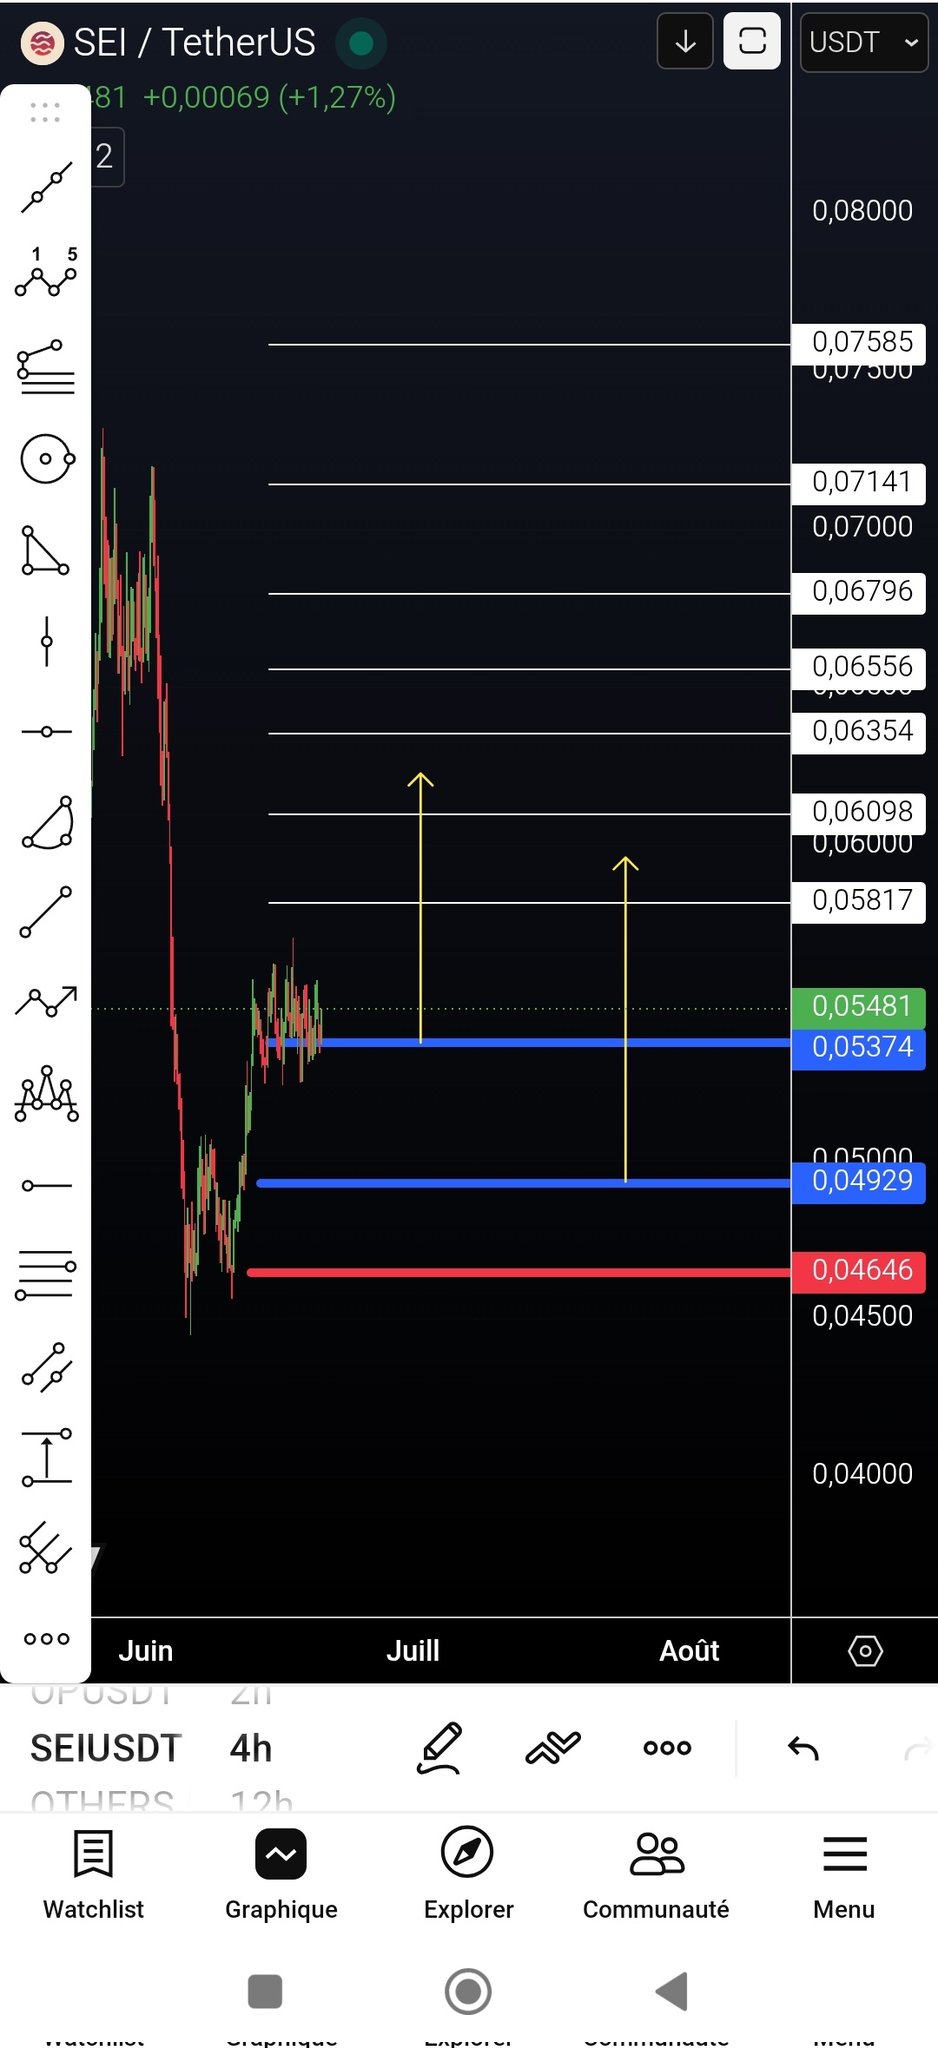
$SEI at $0.05
$INJ at $5
$SUI just under $1
$ONDO with 3X to $1
$TAO holding $200
And most people are still treating it like the cycle is dead.
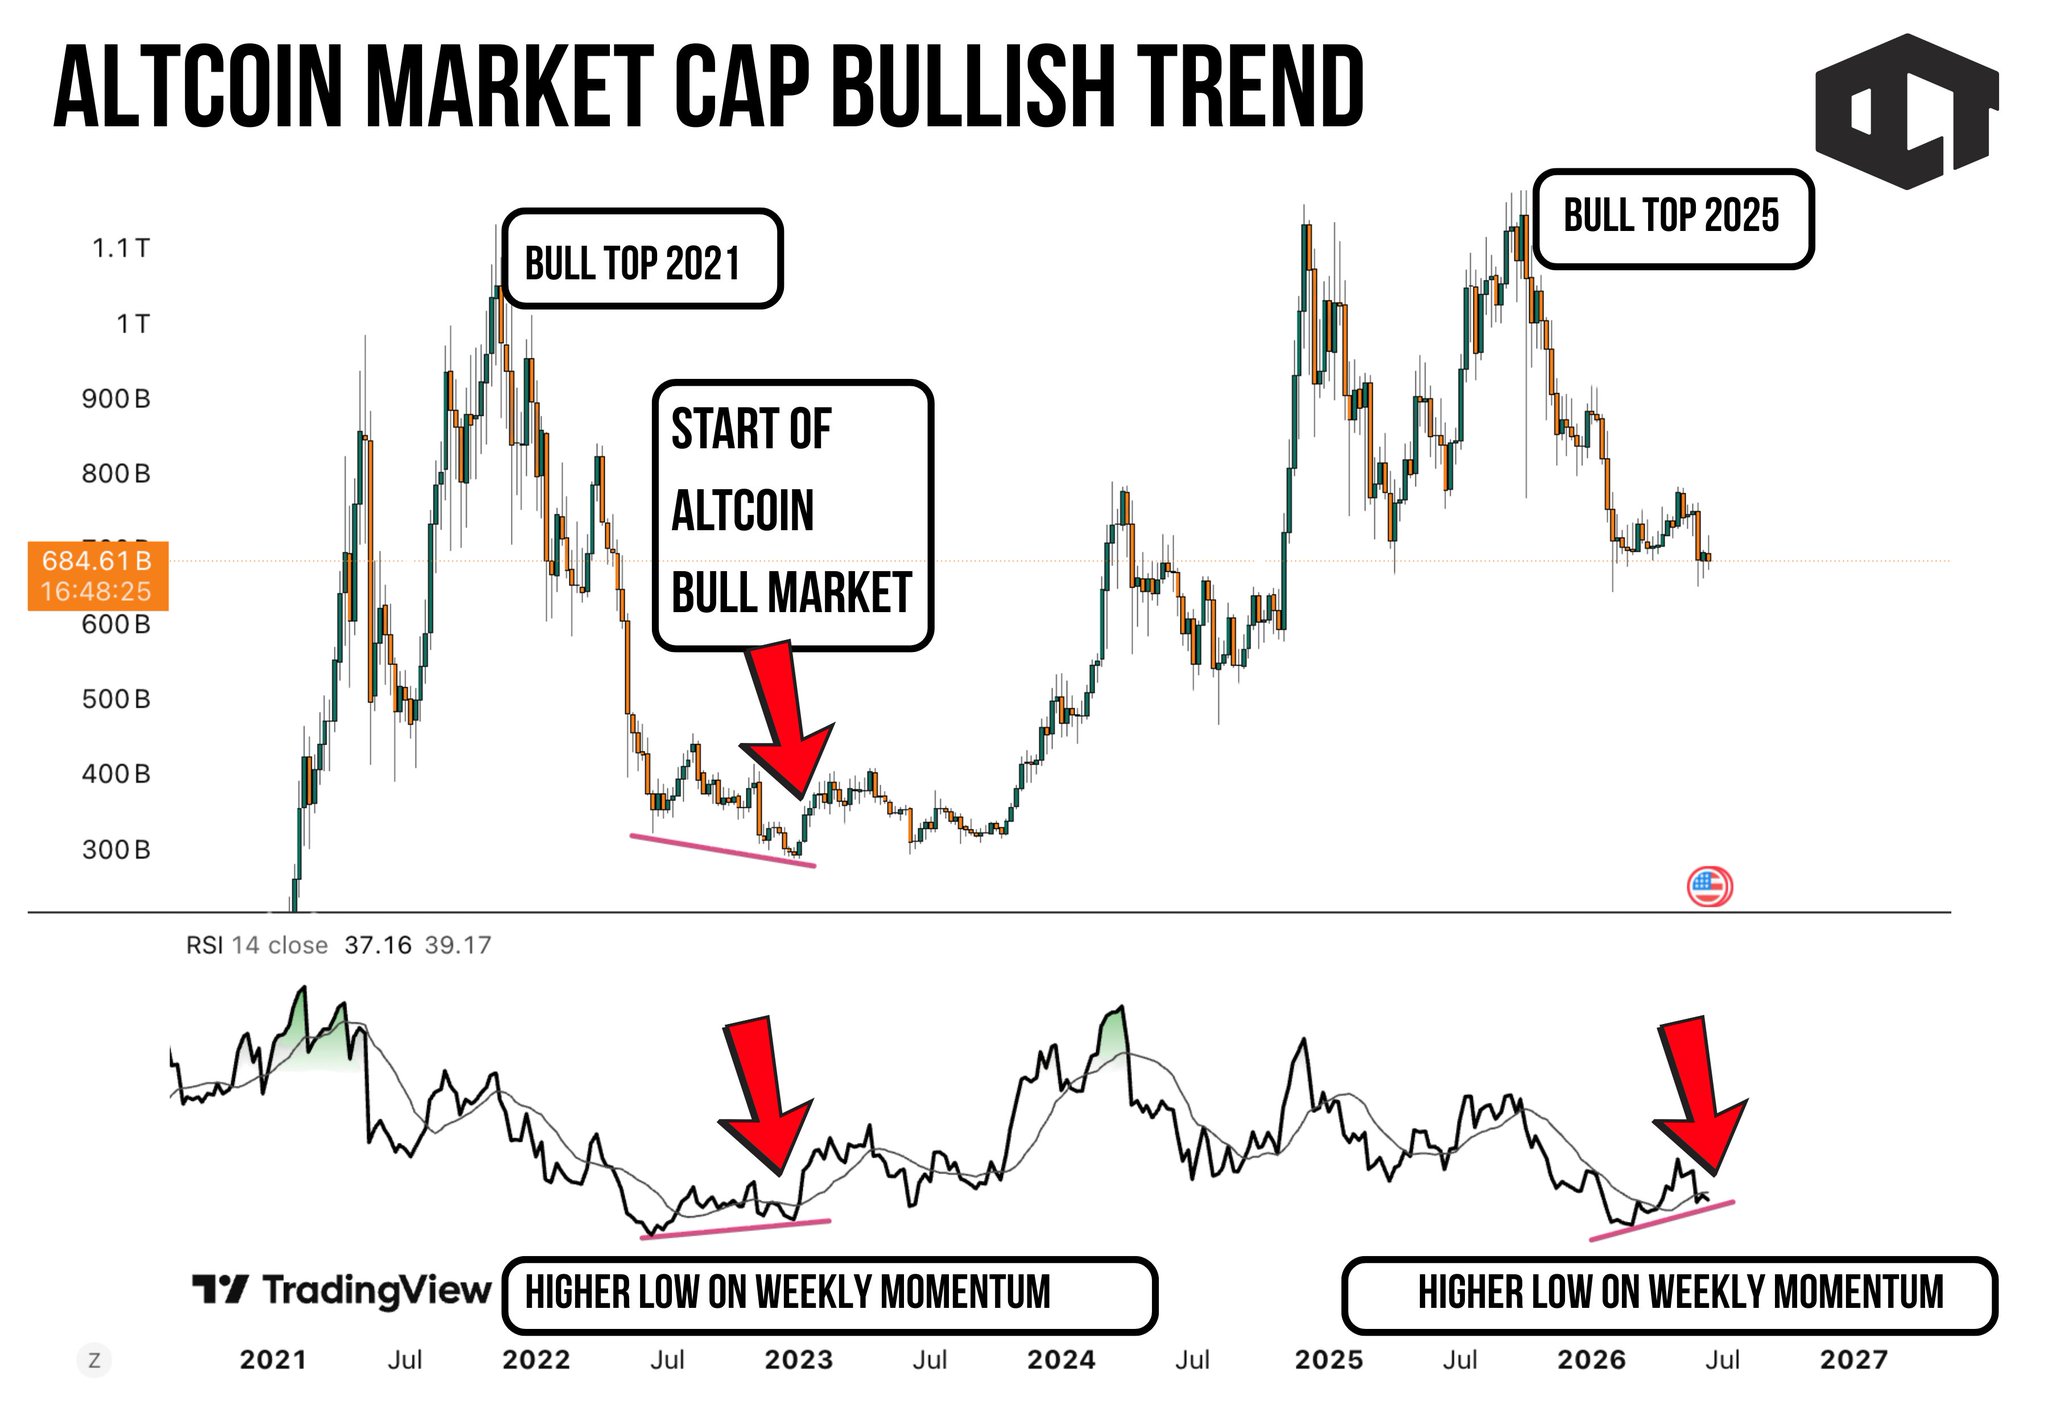
The TOTAL3 weekly chart, which tracks altcoins excluding Bitcoin and Ethereum, is showing something very similar to the 2022 bottom structure.
Not in price but in momentum.
Back in 2022, altcoins kept bleeding while weekly RSI quietly made a higher low after the FTX saga was over.
Price looked weak and was destroyed.
Everyone assumed another collapse is coming.
But the momentum was already shifting underneath the surface.
That higher low on weekly RSI marked the start of the next major altcoin recovery.
Now look at the current chart.
Altcoin market cap is still down heavily from the 2025 bull top, sitting near the $680B zone, but weekly momentum is again forming a higher low while price refuses to break into a deeper capitulation.
This is exactly the kind of setup that confuses retail.
Because the chart does not look bullish emotionally.
It looks boring, damaged and like nothing is happening.
But that is usually where the reversal structure begins.
→ PRICE IS HOLDING ABOVE THE PANIC ZONE
TOTAL3 has corrected hard, but it has not erased the entire move from the last cycle expansion.
That means the market is weak, but not dead.
→ WEEKLY MOMENTUM IS IMPROVING
The RSI is building a higher low, which tells us sellers are losing strength even while price still looks heavy.
That is how bottoms usually form.
→ THE 2022 FRACTAL IS BACK
The last time altcoins showed this kind of weekly momentum divergence, the market was much closer to the start of an altcoin bull phase than the end of one.
This does not mean altcoins go vertical tomorrow.
But it does mean the bearish momentum may already be fading.
The crowd is waiting for confirmation.
And the chart is already showing accumulation.