Comprar cripto
tarjeta
Comercio P2P
Compra USDT en un marketplace
Tarjeta de crédito/débito
Compre criptomonedas con Visa o MasterCard
Pago vía prestadores
Compre criptomonedas a través de MoonPay, Simplex y más
Tarjeta BitMart
Impulsando su experiencia con las criptomonedas
Tarjeta prepago de criptomonedas
Obtenga una Mastercard lista para usar al instante
Comerciar
USDⓈ-M
Utilizando USDⓈ como colateral
COIN-M
Utilizando la propia moneda como colateral
TradFi
Trading integral para metales, acciones y forex
Operativa de demostración
Aprenda a operar con riesgo cero
Resumen de futuros
Plataforma única para todo lo relacionado con futuros
Rey de Futuros
Pool de premios de 478 000 USDT
Crecer
Resumen de Earn
Activos inactivos, gane con facilidad
Ahorros
Gane intereses conservando su portafolio.
Staking
Staking sencillo, cuantiosas retribuciones.
Gestión de patrimonio
Aumente su riqueza con un equipo de activos top
RWA
Mantenga BMRUSD, disfrute del rendimiento
Exclusivo VIP
Gane de forma estable para usuarios VIP
Rewards
Centro de recompensas
Descubra recompensas exclusivas por valor de hasta 14 000 USDT
LaunchPrime
Una plataforma para lanzar tokens y NFT
Programa de afiliados
Únase para ganar cuantiosas comisiones
Powerdrop
¡La solución AirDrop de próxima generación ya está AQUÍ!
Centro de eventos
El centro unificado para todas las operaciones de trading
Sorteo diario de futuros
100 % de probabilidades de ganar con operaciones diarias
Sorteo diario de Spot
Gane 8888 USDT en grandes premios
Recarga móvil
Recargue móviles de forma fácil, online y segura
Send
Send money globally, fast and secure
BitMart Mall
Viva de las criptomonedas

Sei Datos de precios en tiempo real
El precio de hoy de Sei es de $ 0.054 (SEI/USD). Con una capitalización de mercado de $ 395.80M USD. Volumen de trading en 24 horas de $ 568.58K USD, Un cambio de precio en 24 horas de +2.81%. Y un suministro circulante de 7.22B SEI.
Sei SEI Historial de precios USD
Siga el precio de Sei para hoy, 7 días, 30 días y 90 días
Periodo
Cambiar
Cambio (%)
Hoy
$ 0.0011
2.23%
7días
$ 0.0013
2.62%
30días
$ 0.0069
-11.31%
90días
$ 0.0044
-7.58%
Sea propietario de SEI ahora
Compra y vende SEI fácil y seguro en BitMart.
Sei Información de mercado
$ 0.053 Autonomía de 24 horas $ 0.056
Máximo histórico
$ 1.14
El mínimo histórico
$ 0.044
Cambio en 24 h
2.81%
Volumen en 24 h
$ 568,575.09
Suministros en circulación
7.21B
SEI
Market Cap
$ 395.80M
Suministro máximo
10.00B
SEI
Capitalización de mercado totalmente diluida
$ 548.37M
Trade SEI
Ganar
Pon a trabajar tus criptomonedas inactivas y obtén ingresos pasivos a través de ahorros, staking y más.
Sei X Insight

OCT Trades
TA_Analyst
Trader
B
 5.2K @oct_trades
 Extremadamente alcista
Altcoin market is in a dangerously bullish setup, with weekly momentum RSI forming higher lows, indicating a major recovery.

Our Crypto Talk
Media
OnChain_Analyst
C
79.7K @ourcryptotalk ALTCOINS IN A DANGEROUSLY BULLISH SETUP.
Just like it was after FTX Crash 👀
This gets even better when we see some bottomed charts like :
$SEI at $0.05
$INJ at $5
$SUI just under $1
$ONDO with 3X to $1
$TAO holding $200
And most people are still treating it like the cycle is dead.
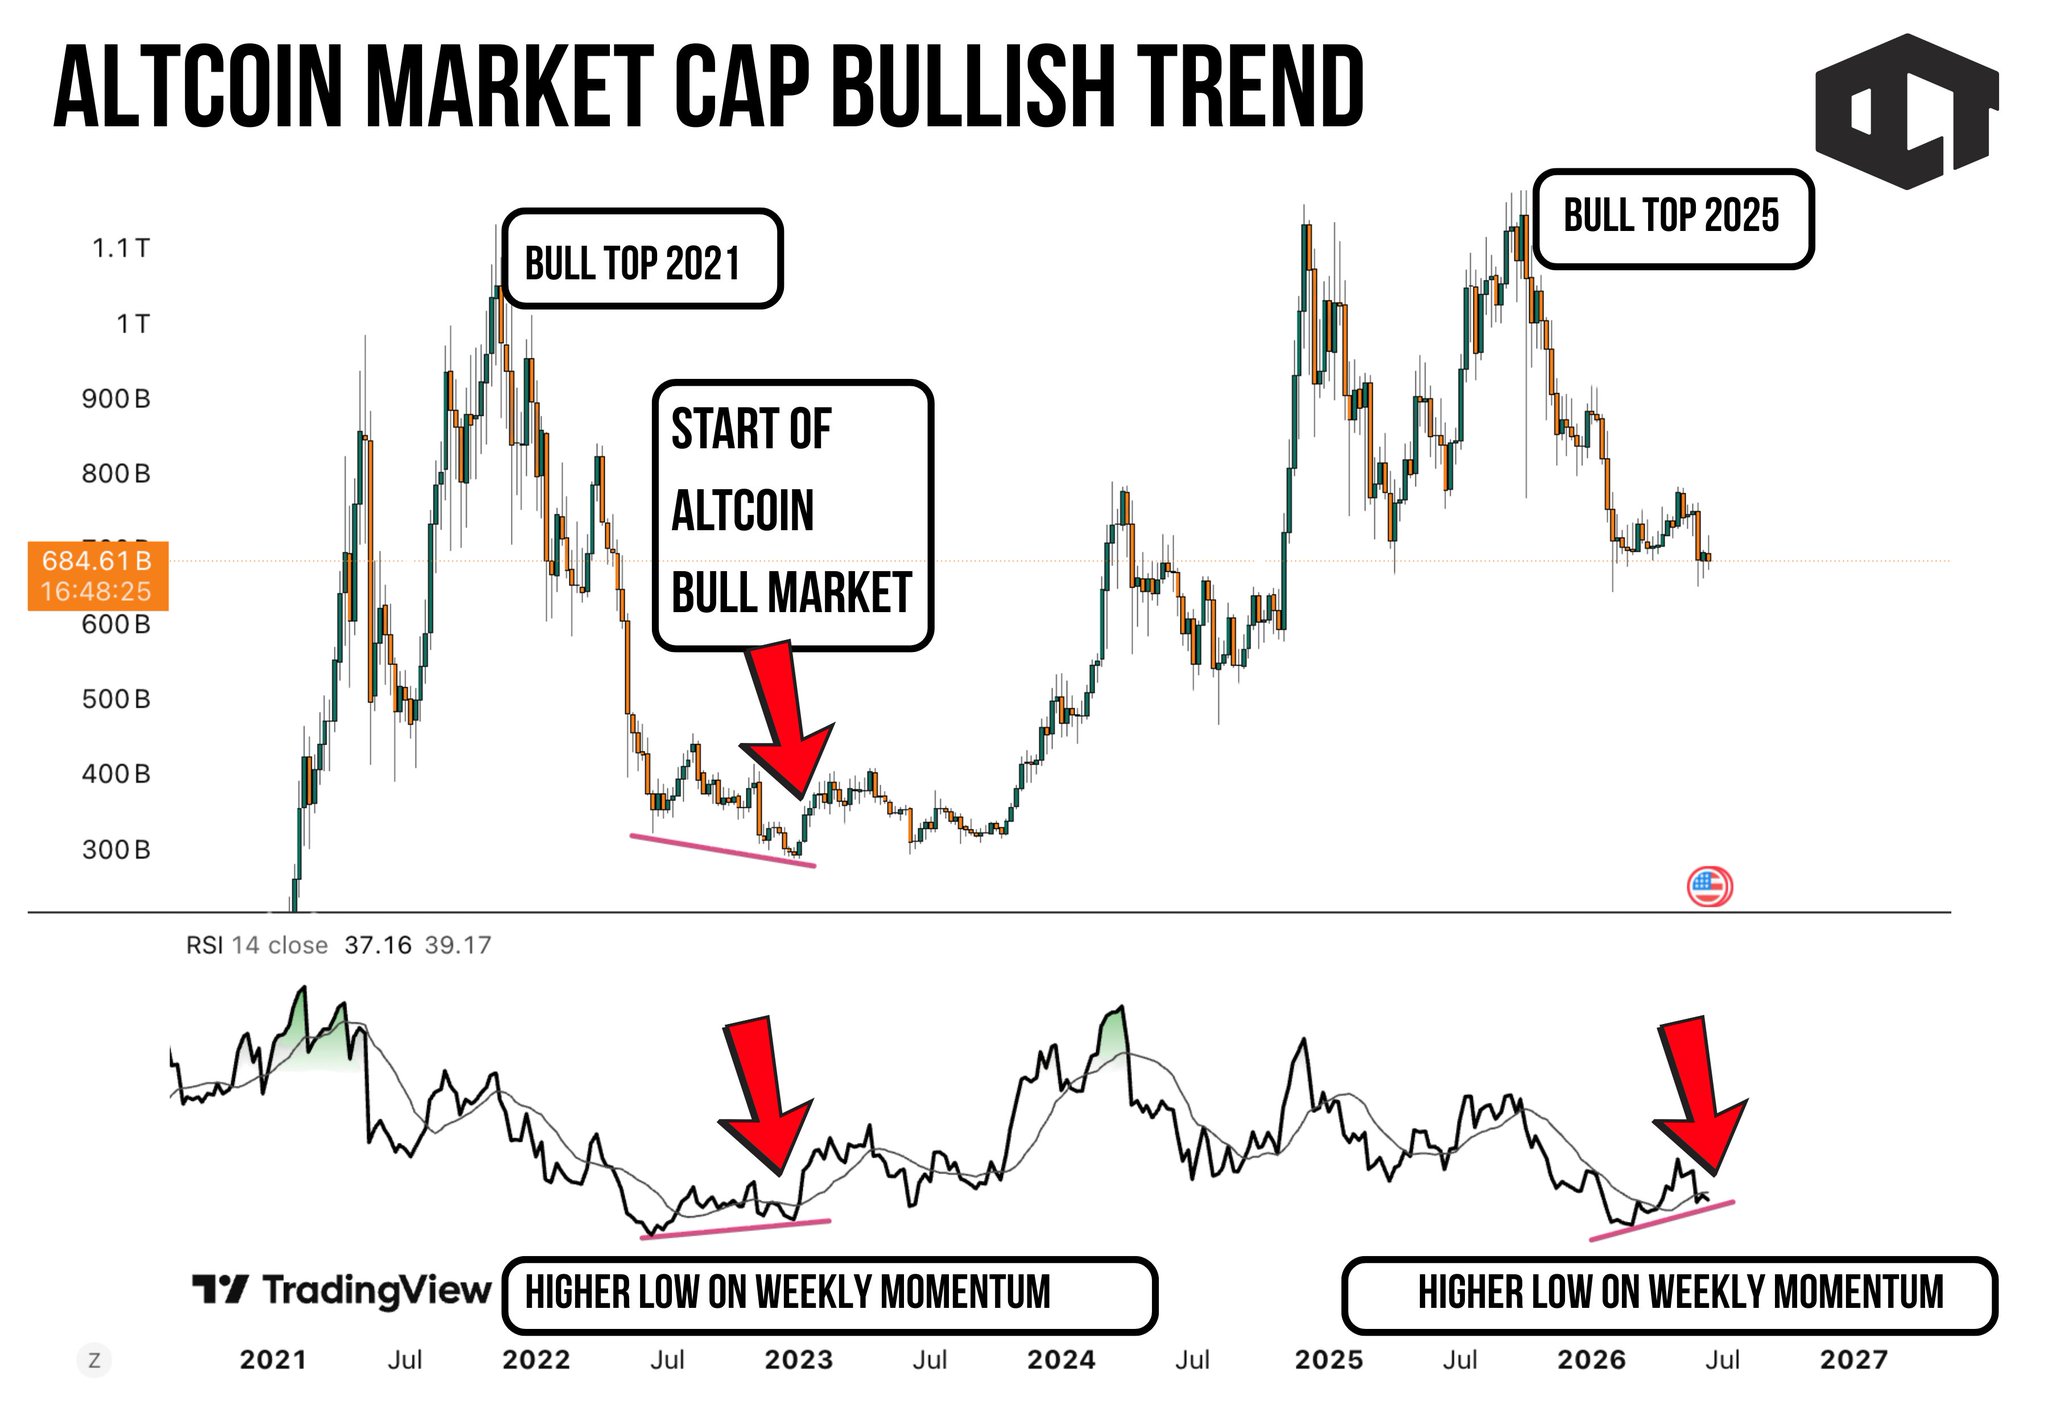
The TOTAL3 weekly chart, which tracks altcoins excluding Bitcoin and Ethereum, is showing something very similar to the 2022 bottom structure.
Not in price but in momentum.
Back in 2022, altcoins kept bleeding while weekly RSI quietly made a higher low after the FTX saga was over.
Price looked weak and was destroyed.
Everyone assumed another collapse is coming.
But the momentum was already shifting underneath the surface.
That higher low on weekly RSI marked the start of the next major altcoin recovery.
Now look at the current chart.
Altcoin market cap is still down heavily from the 2025 bull top, sitting near the $680B zone, but weekly momentum is again forming a higher low while price refuses to break into a deeper capitulation.
This is exactly the kind of setup that confuses retail.
Because the chart does not look bullish emotionally.
It looks boring, damaged and like nothing is happening.
But that is usually where the reversal structure begins.
→ PRICE IS HOLDING ABOVE THE PANIC ZONE
TOTAL3 has corrected hard, but it has not erased the entire move from the last cycle expansion.
That means the market is weak, but not dead.
→ WEEKLY MOMENTUM IS IMPROVING
The RSI is building a higher low, which tells us sellers are losing strength even while price still looks heavy.
That is how bottoms usually form.
→ THE 2022 FRACTAL IS BACK
The last time altcoins showed this kind of weekly momentum divergence, the market was much closer to the start of an altcoin bull phase than the end of one.
This does not mean altcoins go vertical tomorrow.
But it does mean the bearish momentum may already be fading.
The crowd is waiting for confirmation.
And the chart is already showing accumulation.
 113
113
 17
17
 5.8K
5.8K
2026-06-21 07:27
Tendencia de SEI tras el lanzamiento
Extremadamente alcista
Altcoin market is in a dangerously bullish setup, with weekly momentum RSI forming higher lows, indicating a major recovery.
Our Crypto Talk
Media
OnChain_Analyst
C
79.7K @ourcryptotalk Extremadamente alcista
Altcoin market is showing a dangerously bullish pattern, weekly momentum is making higher lows, indicating a reversal similar to 2022.
ALTCOINS IN A DANGEROUSLY BULLISH SETUP.
Just like it was after FTX Crash 👀
This gets even better when we see some bottomed charts like :
$SEI at $0.05
$INJ at $5
$SUI just under $1
$ONDO with 3X to $1
$TAO holding $200
And most people are still treating it like the cycle is dead.
The TOTAL3 weekly chart, which tracks altcoins excluding Bitcoin and Ethereum, is showing something very similar to the 2022 bottom structure.
Not in price but in momentum.
Back in 2022, altcoins kept bleeding while weekly RSI quietly made a higher low after the FTX saga was over.
Price looked weak and was destroyed.
Everyone assumed another collapse is coming.
But the momentum was already shifting underneath the surface.
That higher low on weekly RSI marked the start of the next major altcoin recovery.
Now look at the current chart.
Altcoin market cap is still down heavily from the 2025 bull top, sitting near the $680B zone, but weekly momentum is again forming a higher low while price refuses to break into a deeper capitulation.
This is exactly the kind of setup that confuses retail.
Because the chart does not look bullish emotionally.
It looks boring, damaged and like nothing is happening.
But that is usually where the reversal structure begins.
→ PRICE IS HOLDING ABOVE THE PANIC ZONE
TOTAL3 has corrected hard, but it has not erased the entire move from the last cycle expansion.
That means the market is weak, but not dead.
→ WEEKLY MOMENTUM IS IMPROVING
The RSI is building a higher low, which tells us sellers are losing strength even while price still looks heavy.
That is how bottoms usually form.
→ THE 2022 FRACTAL IS BACK
The last time altcoins showed this kind of weekly momentum divergence, the market was much closer to the start of an altcoin bull phase than the end of one.
This does not mean altcoins go vertical tomorrow.
But it does mean the bearish momentum may already be fading.
The crowd is waiting for confirmation.
And the chart is already showing accumulation.
113
17
5.8K
2026-06-21 07:27
Tendencia de SEI tras el lanzamiento
Extremadamente alcista
Altcoin market is showing a dangerously bullish pattern, weekly momentum is making higher lows, indicating a reversal similar to 2022.

🇲🇦 CRYPTO🇲🇦BLACK🇲🇦TIGER🇲🇦
TA_Analyst
Trader
C
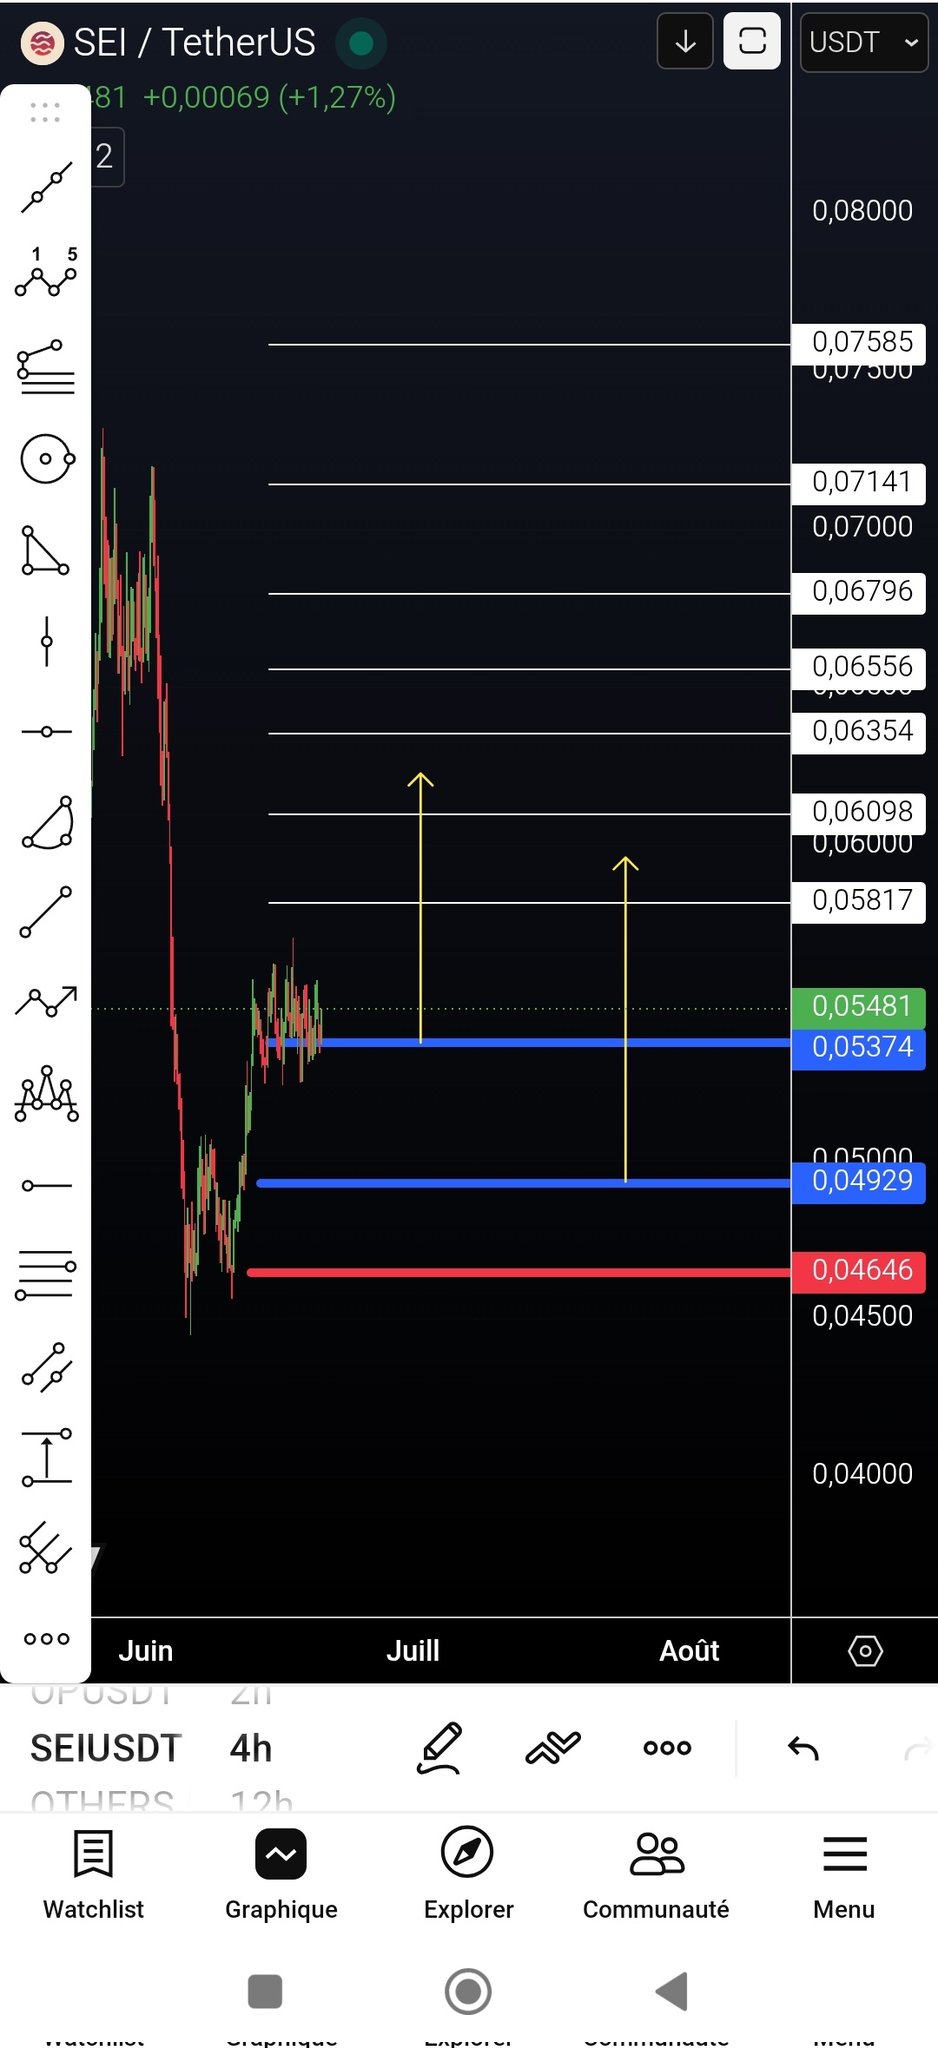
22.2K @CHARTBTC1 Alcista
If SEI can hold its support level, a rebound is possible, but the target is conservative; the subsequent trend needs to be monitored.
#SEI $SEI
If the token holds this support, it may rebound.
As you can see, I didn't set large targets because there's a lot of talk about this coin.
Set a slightly distant stop with a three‑day close.
If it rebounds, we'll update the token's status to see whether it has moved significantly into positive territory.
Good luck to everyone ♥️ https://t.co/R5CDeT4xxi

abdellatif EL Aissaoui🇲🇦🇲🇦 D
89 @abdella44393170 @CHARTBTC1 Sei
13
3
1.6K
2026-06-20 22:57
Tendencia de SEI tras el lanzamiento
Alcista
If SEI can hold its support level, a rebound is possible, but the target is conservative; the subsequent trend needs to be monitored.
Predicción de precios
¿Cuándo es un buen momento para comprar SEI? ¿Debería comprar o vender SEI ahora?
Al decidir si es un buen momento para comprar o vender Sei (SEI), es importante ajustarse primero a su propia estrategia de trading y perfil de riesgo. Los inversores a largo plazo y los traders a corto plazo suelen interpretar las condiciones del mercado de forma diferente, por lo que su decisión debe reflejar su enfoque personal. Según el último análisis técnico de 4 horas de SEI, la señal de trading actual es Vender. Según el último análisis técnico de 1 día de SEI, la señal actual es Hold.

Predicción de Beacon
Pronóstico probabilístico de precios (próximas 24 horas)Descargo de responsabilidad de la predicción de Beacon
Los resultados de los datos que se muestran en esta página se analizan en función de los datos de trading reales (OHLCV) del par de trading seleccionado junto con los indicadores técnicos correspondientes.
Esta predicción es un producto técnico experimental y se proporciona solo con fines de referencia. No constituye un consejo de inversión. Los acontecimientos inesperados del mundo real pueden influir significativamente en el comportamiento del mercado. Por tanto, los traders deben tomar decisiones con precaución.
Esta predicción es un producto técnico experimental y se proporciona solo con fines de referencia. No constituye un consejo de inversión. Los acontecimientos inesperados del mundo real pueden influir significativamente en el comportamiento del mercado. Por tanto, los traders deben tomar decisiones con precaución.
Sobre Sei
Sei (SEI) is a cryptocurrency launched in 2023. Sei has a current supply of 10,000,000,000 with 7,217,777,777 in circulation. The last known price of Sei is 0.05500533 USD and is up 2.80 over the last 24 hours. It is currently trading on 369 active market(s) with $31,761,944.23 traded over the last 24 hours. More information can be found at https://www.sei.io/.
Leer más
Enlaces oficiales
Explorador de blockchain


Comprar SEI
Trade SEI