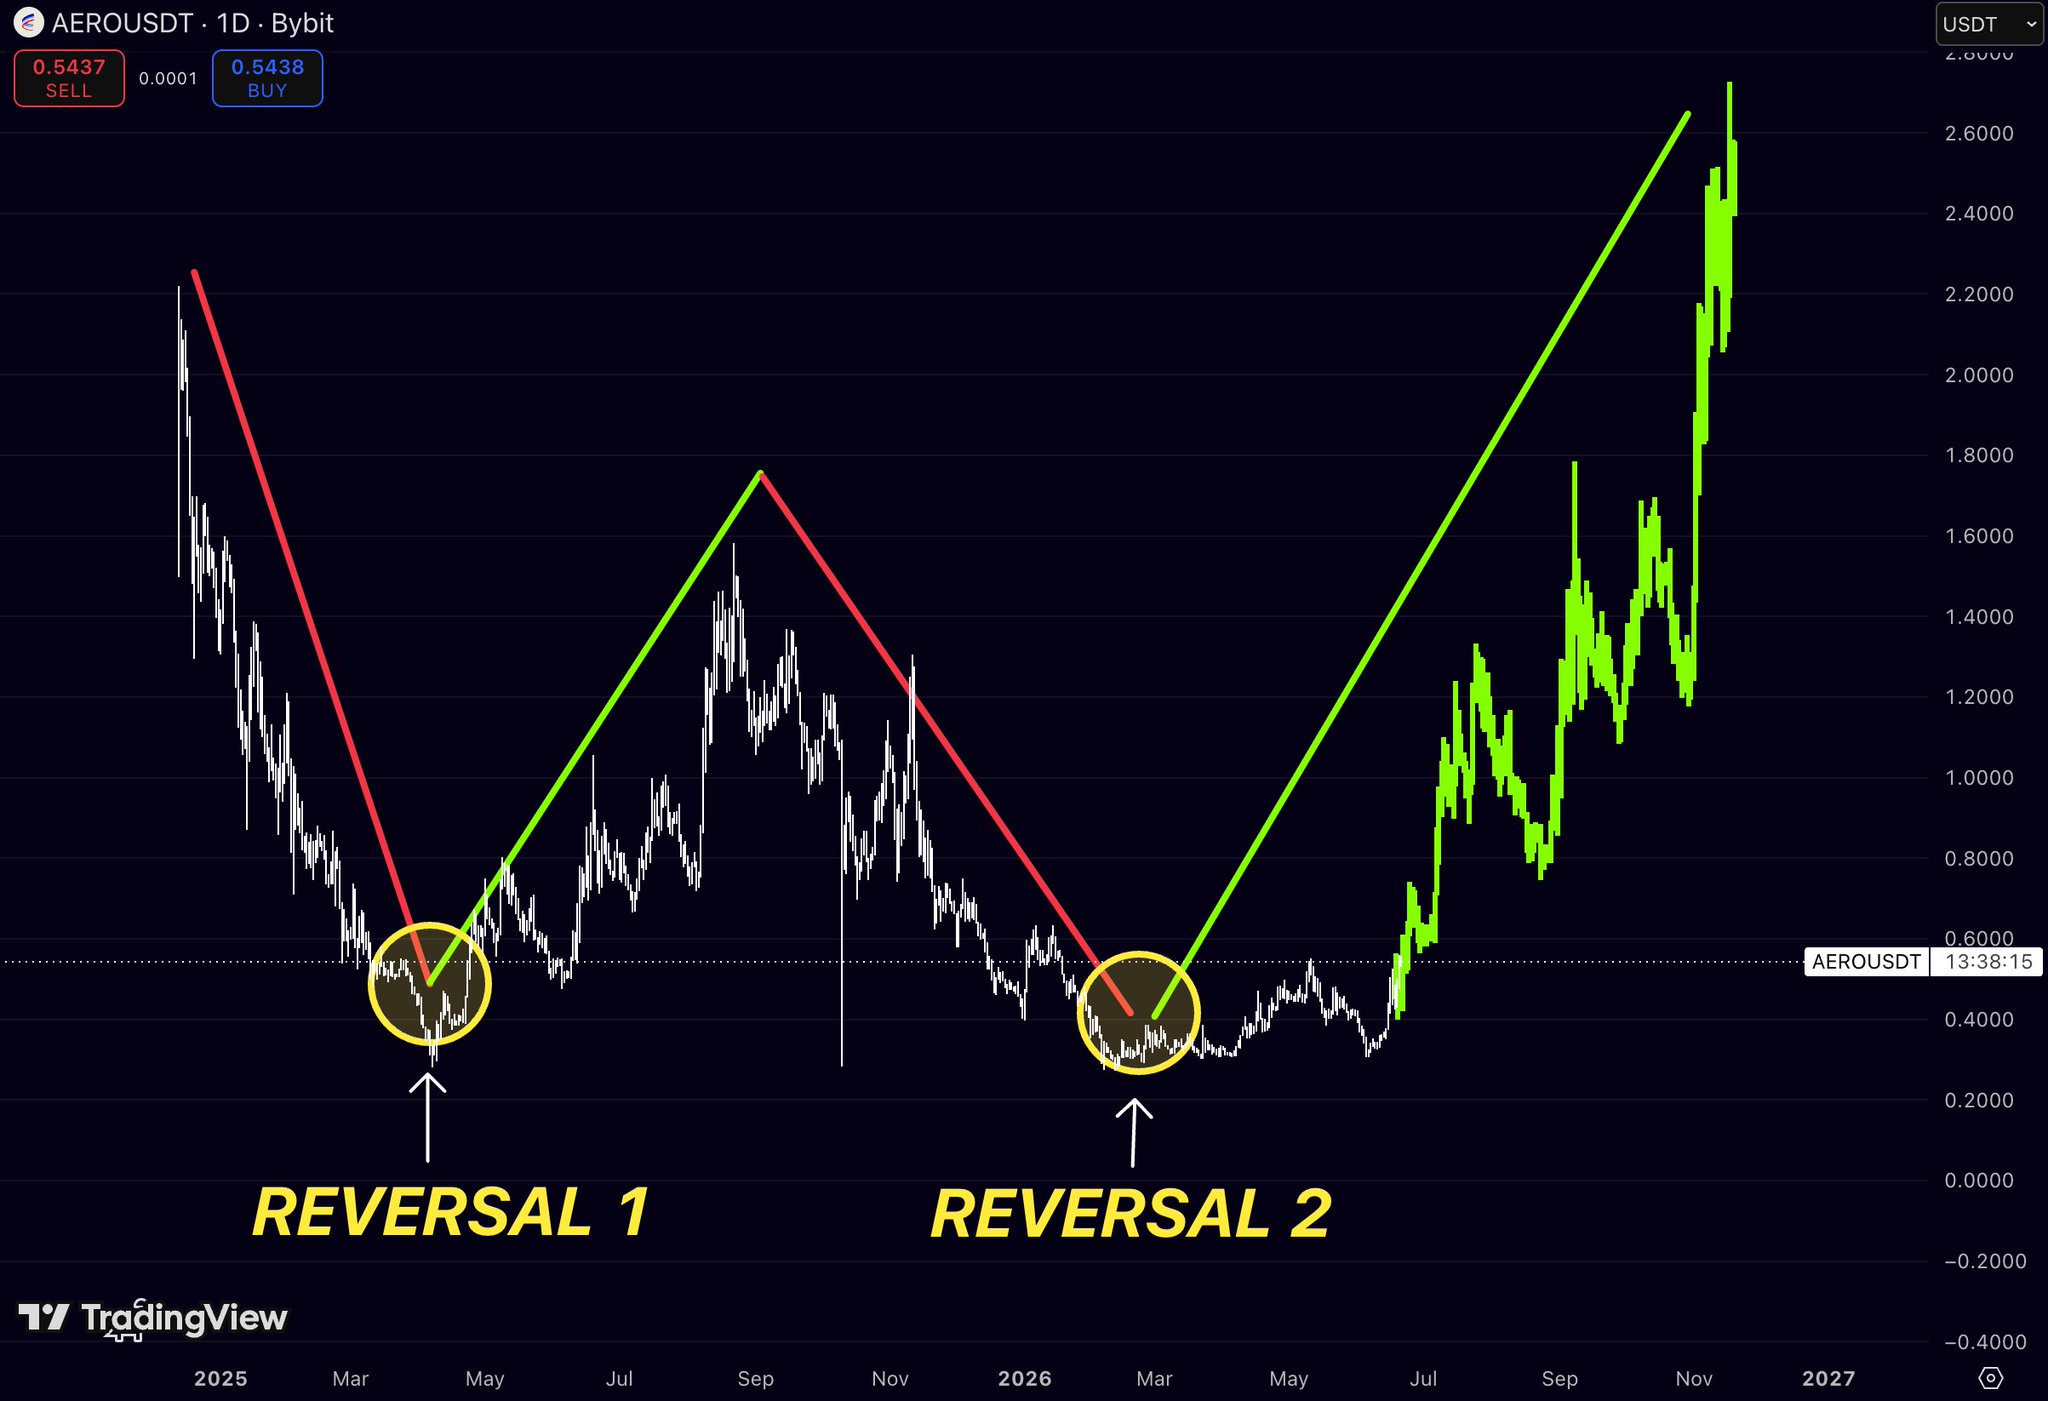
$AERO is repeating the same reversal pattern for the second time
Look closely
The first major downtrend ended with a capitulation phase
followed by a rounded bottom and a powerful expansion move
Months later, the market printed almost the exact same structure again
Another prolonged decline
Another accumulation zone
Another reversal
And once buyers stepped in, price exploded
That’s what makes this chart interesting
Not the rally itself
The symmetry
Reversal #1 led to a massive trend expansion
Reversal #2 is already producing the same behavior
Higher lows
Higher highs
Strong impulsive legs followed by healthy consolidations
That’s not what weak charts do
Most traders spend months trying to identify bottoms
$AERO has already shown where buyers are willing to defend
Twice
The market had multiple opportunities to break lower
Instead, every major selloff was absorbed and followed by aggressive upside continuation
As long as the structure of higher highs and higher lows remains intact, the trend remains clear
The first reversal wasn’t a coincidence
The second one is confirmation
And if history continues to rhyme
the current move may still be in its early innings
$AERO keeps proving that every major correction has been a setup for the next expansion phase