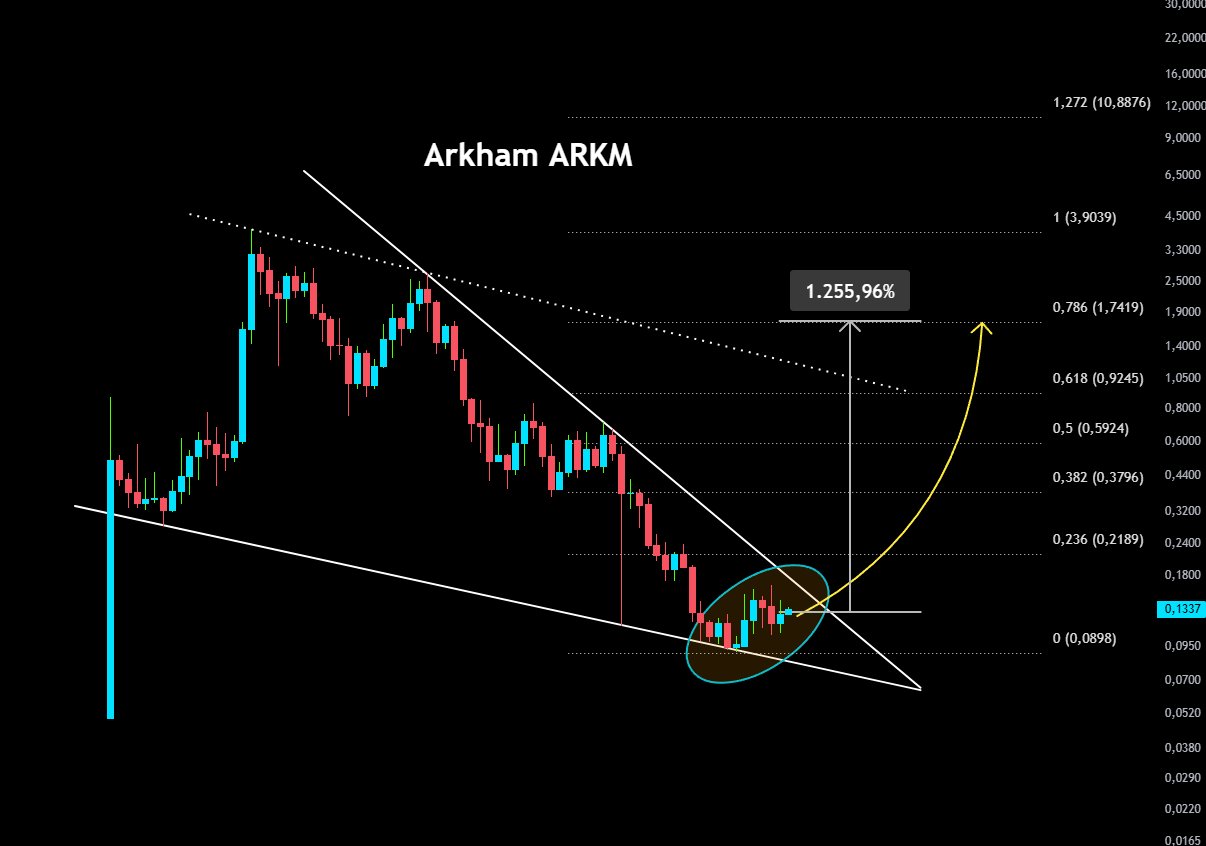
In the Arkham chart, the descending wedge pattern that the price has been moving within for a long time appears to be in an upward breakout phase.
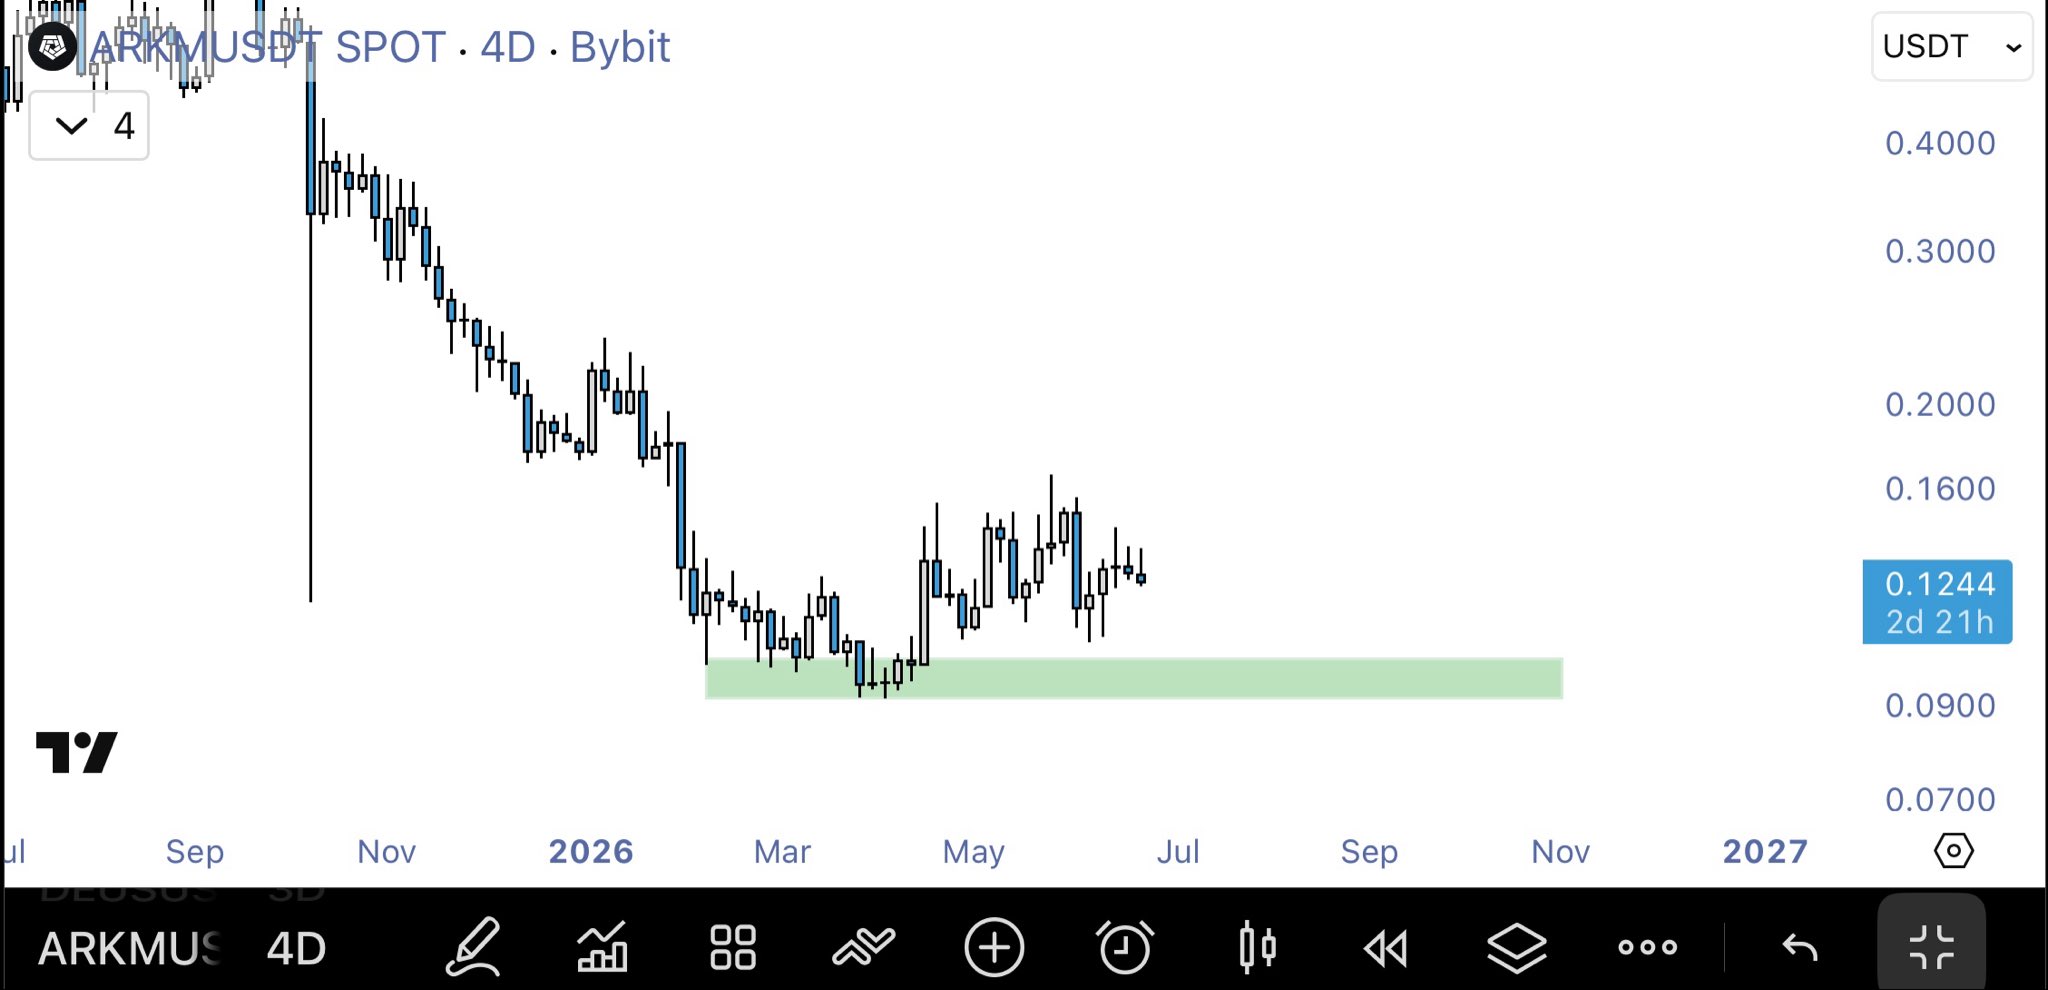
The area marked with a turquoise circle represents a critical reversal zone where the descending trend resistance is being challenged, and buying from dip levels is attempting to hold the price at the 0,1337 level.
A volume‑confirmed break at the current 0,1337 level could fully end the pair’s downtrend and turn the technical outlook positive.
If the formation completes upward, the projection on the chart suggests that the upper resistance levels indicated by the yellow arrow, with a 1,255.96% rise potential, can be followed as a medium‑to‑long‑term target.
Do you think Arkham, with its strong stance among AI and data‑analytics‑focused projects, can turn this critical wedge breakout into a massive rally?
Let’s meet in the comments.
#ARKM #Arkham #Crypto $ARKM